Graphing
Data Visualization
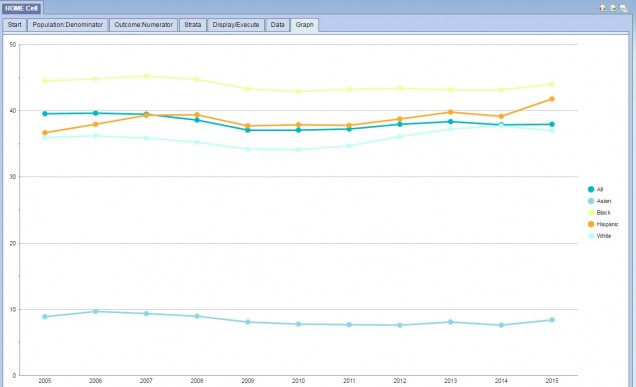
The HOME Cell also allows visualization of strata and outcome data over time in graphs. The example below shows the graphical version of the “Adult Obesity Rates – 2005 to 2015” data.
Data Visualization
The HOME Cell also allows visualization of strata and outcome data over time in graphs. The example below shows the graphical version of the “Adult Obesity Rates – 2005 to 2015” data.