Research Networking
Welcome to the BU Research Networking Blog!
As Faculty Lead for Research Networking (RN) at BU, I have started this Blog to educate people by sending out occasional posts about the new and exciting RN activities at BU and in the scientific community.
If you are new to Research Networking then you might be interested to learn that Research Networking commonly employs online applications to discover and use research and scholarly information about people and resources. RN applications, also know as tools (RN tools), serve as knowledge management systems for the researchers regardless of whether the researchers that use them work in academic institutions, foundations, government, or in industry. RN tools connect institutional systems, broad research networks, public research data, and restricted data by collecting accessible information from a wide range of sources and then aggregates and organizes the information as expertise profiles for faculty, investigators, scholars, clinicians, community partners, and facilities. RN tools help people find and create new collaborations and enable team science to address new or existing research challenges by making information about researchers, expertise, and resources rapidly accessible and searchable.
BU has its own Research Networking system called BU Profiles which I urge you to check out. I will be writing about this excellent free resource for BU faculty, Industry Partners, and the Academic community at in this Blog.
Altmetrics
Daily, Alternative Research Metrics (Altmetrics) are generating real-time evidence of an investigator’s research influence through social media. Alternative Research Metrics help you as an researcher to better understand how and where your scholarship is being discussed, shared, integrated, and adopted by scholars and, most notably, the public. It is this public engagement information that universities and funders are increasingly asking researchers to become aware of and document as part of their research activities. While these new metrics have their critics, it is our hope and expectation that understanding and taking advantage of the strengths these metrics will lead to improved metrics and clarity on their use in academics. Have you looked at what tracks you have been making lately?
Most reserachers understand that publications and citations are laboriously slow to accumulate. Used alone, they may provide only a narrow view of the value of your activities. As research content is routinely disseminated, discussed, shared, recommended, or otherwise used online, researchers now have access to immediate feedback on the reach and influence of their work.
Every day, researchers broadcast scholarly influence in “trackable” forms such as slide presentations, papers, datasets, banks/repositories, training materials, scholarly tweets and blogs. Reference companies like Mendeley, CiteULike and Zotero are making a business out of data collection via social media to track and report the influence of researchers’ work. Scholarly debates about the current hot paper, once confined by academic walls, is now blasted across the web. These “tracks” researchers make are called “Alternative Research Metrics,” or “altmetrics.”
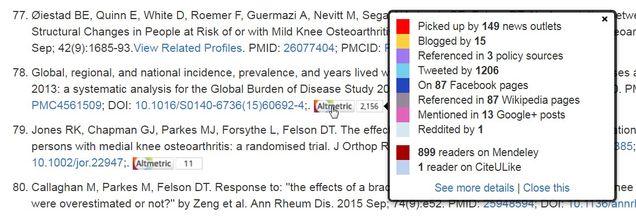
In BU Profiles, Altmetric Attention Scores are displayed on many publications, which link to a details page showing the source and geographical breakdown of activity, allows you to subscribe to alerts and other details.

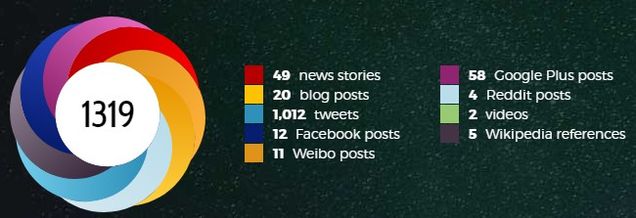
One of the highest rated attention scores in 2015 came from this publication with contributions from BU authors. The BU library is showing altmetrics on many of the articles found in BU Library Search, as will a new tool called My CV, available soon at BU.
An Altmetric Badge (the “donut”) displays different colors that correspond to the source of content. Twitter activity shows as blue, news outlets as red and public policy as purple. Sources are weighted differently—an international news outlet contributes more than local news, which contributes more than a blog post, which contributes more than a tweet. More mentions equals a higher score, but the method matters, too. An academic peer like a physician-scientist mentioning an article to many other academic peers counts much more than a journal pushing out the same article automatically; a person with a verified social media account with thousands of followers counts more than an unverified account with five followers. Twitter Favorites and Facebook Likes are not included because that activity is easy to purchase/manufacture. Some important sources are not counted because they are not broadly transparent — Mendeley readers, Scopus citation counts, publisher embargo-restricted pubs, etc.

It is also important to note that there are limitations with altmetrics, for example, it is a relatively new metric and currently only focused on English language sources. The metrics are only quantitative, and while they suggest the volume of attention being paid to certain research, manual effort is required to assess the underlying qualitative data (who is saying what about the research). While altmetrics can easily identify trending research, it is still unknown if they closely correlate with long-term impact but predictive analytics are being developed. For now, blending traditional research metrics with altmetrics seems a wise approach to identifying metrics of influence for researcher CVs and funding proposals. To learn more, see these resources:
- A beginner’s guide to altmetrics video;
- Jason Priem (UNC-Chapel Hill) coining the term “altmetric” in a thought-provoking article;
- A guide to including altmetric data in your NIH Biosketch;
- Altmetric’s sources (this is a digital science company founded in 2011 around altmetrics).
- Altmetric’s blog – better management decisions by combining traditional metrics and altmetrics.
- BU Profiles “what’s new” section.
By C. Dorney and D. Fournier