Digital Science Dimensions Badge
Do you know how many of your publications are scientifically influential?
BU Profiles now displays NEW metrics that show the influence of each of your publications using a NEW Dimensions citations badge.
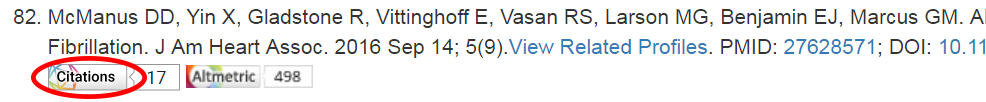
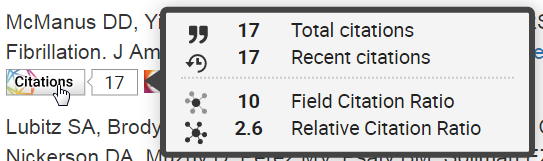
Hovering the cursor over this badge for each article also reveals its recent citations within the last two calendar years, its Field Citation Ratio and its Relative Citation Ratio.
You can use these metrics to compliment the previously added Altmetric badge, discussed here.
The NIH developed the Relative Citation Ratio to measure the scientific influence of an article in a specific field and use it as a benchmark against other NIH-funded award articles published in the last 2 years. It shows the citation impact (uptake) of an article relative to the average for NIH-funded articles. NIH now looks for influential articles (outcomes) associated with different grants and investigators. It provides agencies and study section members with supplemental information to assess proposals and their associated investigators. You can use it to make a case for your scientific influence with proposal submissions, honors and award letters and annual review and promotion. This is a better metric than Journal Impact Factor, which measures the importance of the journal, or citation counts, which are limiting because different fields cite at different rates, and rates go up and down in the time after a publication appears. The Relative Citation Ratio measures citations, but accounts for field differences through normalization and timelines of publications. A value of 1.0 means it has the same number of citations as the average (uptake as expected). A value of 2.0 means that a publication has twice as many citations as the average (uptake above average). If the article hasn’t been cited or is less than two years old a Citation badge will not be visible.
Use the Field Citation Ratio to make a case for your scientific influence:
The Field Citation Ratio metric indicates the relative citation performance of an article when compared to similarly aged articles in its Fields of Research (FoR) subject categories. The metric is normalized to 1.0 to the article’s FoR, which indicates that an article has the same number of citations as the average article (defined by its FoR subject code, publishing year and age). A value of 2.0 indicates that the article has a higher than average number of citations for its group. The metric is calculated for articles published in 2000 and later. Articles that are less than 2 years old will show ‘n/a’ as the FCR.
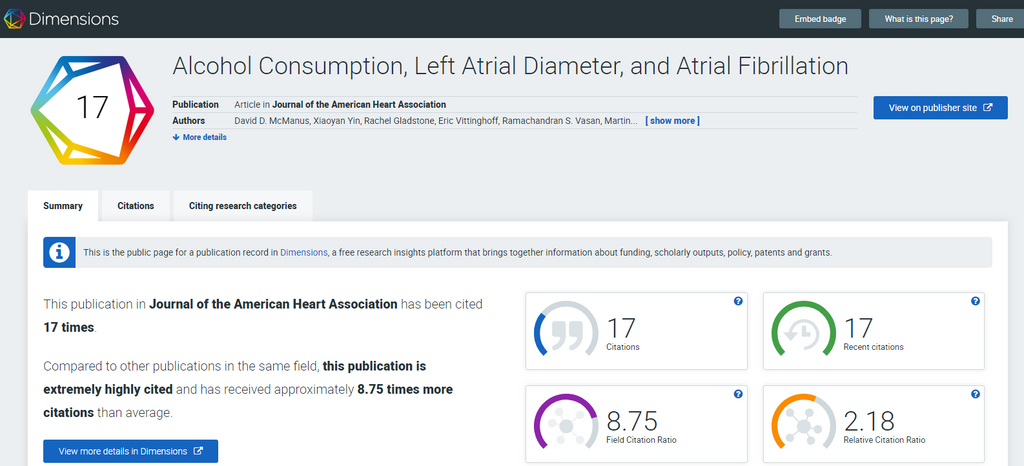
Clicking on the citation badge will reveal additional details on these four metrics and will enable you to view citing publications, the actual publication on the publisher site, and the citing research categories.
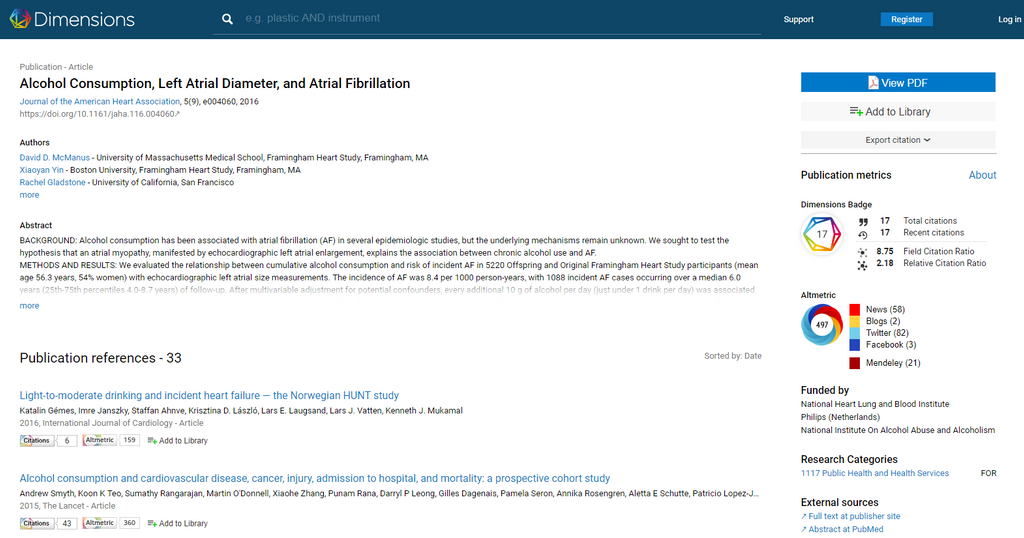
If you click the “view more details in Dimensions” button you’ll often get the abstract, publication references, the ability to view a PDF or add it to your own Dimensions library, funding information, external source links and various publication metrics.
In summary, faculty should be knowledgeable about how their scholarly contributions influence science in general, and in their respective fields specifically. This is particularly important now that NIH has begun assessing the outcomes of funded grants in terms of their success in generating influential work – which investigators publish more articles that are influential, and which have less. We believe that faculty who work in a culture of publish or perish must consider these new metrics, which provide increasing insight into their influence, and not merely their productivity.
To learn more, see these resources:
- NIH Perspective – Measuring impact of NIH-supported pubs with the Relative Citation Ratio
- RCR: A new metric that uses citation rates to measure influence at the article level
- The quiet rise of the NIH’s hot new metric
- NIH metric that assesses article impact stirs debate
- Citation Badge Announcement
- What is the Citation Badge Details Page?
- How the Field Citation Ratio is calculated
By C. Dorney, C. Shanahan & D. Fournier