Research Networking
Welcome to the BU Research Networking Blog!
As Faculty Lead for Research Networking (RN) at BU, I have started this Blog to educate people by sending out occasional posts about the new and exciting RN activities at BU and in the scientific community.
If you are new to Research Networking then you might be interested to learn that Research Networking commonly employs online applications to discover and use research and scholarly information about people and resources. RN applications, also know as tools (RN tools), serve as knowledge management systems for the researchers regardless of whether the researchers that use them work in academic institutions, foundations, government, or in industry. RN tools connect institutional systems, broad research networks, public research data, and restricted data by collecting accessible information from a wide range of sources and then aggregates and organizes the information as expertise profiles for faculty, investigators, scholars, clinicians, community partners, and facilities. RN tools help people find and create new collaborations and enable team science to address new or existing research challenges by making information about researchers, expertise, and resources rapidly accessible and searchable.
BU has its own Research Networking system called BU Profiles which I urge you to check out. I will be writing about this excellent free resource for BU faculty, Industry Partners, and the Academic community at in this Blog.
Is the h-index right for you?
Author-level metrics that investigators could select include total publication count, first-author publication count, and median and mean citations per publication. Remember that the mean citation per article metric can be significantly skewed and the median citations per publication metric can be low, due to a long tail of papers that are cited a few times, or not cited at all.
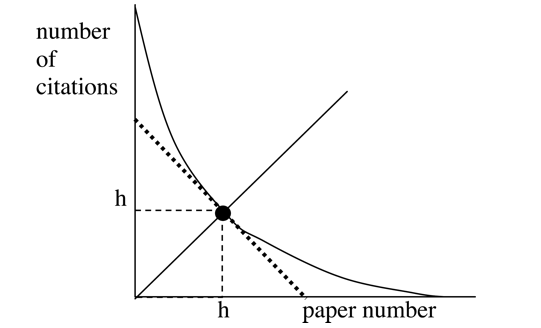
The author’s h-index was designed by physicist Jorge Hirsch in 2005 to address the limitations of citation-focused metrics by creating one easy to understand number that indicates both research productivity and influence. Specifically, it represents the intersection of the number of publications written by an author and the number of times those papers have been cited. For example, an h-index of 12 means the author has 12 publications that have been cited 12 times. It is based on the set of most cited papers and the number of citations in other publications. It also discounts the disproportionate weight of highly cited publications or those not yet cited.

Key questions that many investigators need to answer are: “What is my research influence based on my productivity and the uptake of my work by others? How do I compare to my colleagues in the same field and at same career stage?” The h-index helps to answer the questions. For these reasons, the h-index is the most discussed and most influential metric developed in the past ten years. However, it also has some weaknesses. For example, the value of what is considered to be a “good” h-index varies greatly from discipline to discipline - a world-famous economist might have an h-index of 7, whereas an equally accomplished physician-scientist publishing in medical journals could be near 100. Additionally, the h-index has not been systematically calculated for large disciplinary groups using a standardized method so it cannot be used to benchmark. Also, since the h-index accounts for the total number of citations for the total number of articles, it favors more established scientists who are further into their careers, as opposed to younger or mid-career researchers. Therefore, an h-index should not be used to compare individuals in different fields/disciplines since indices vary by subject and disciplines have different citation practices, nor should a postdoctoral trainee be compared to a mid-career investigator in the same field. The h-index should only be used to compare two individuals in the same discipline at the same stage of their development. Further, the index can vary by the databases and time span used; an h-index calculated from Web of Science will be lower than that from Google Scholar. Only publications in a particular database are counted, thus books and conference proceedings that are underreported in a database (compared to publications) will be excluded from the calculation.

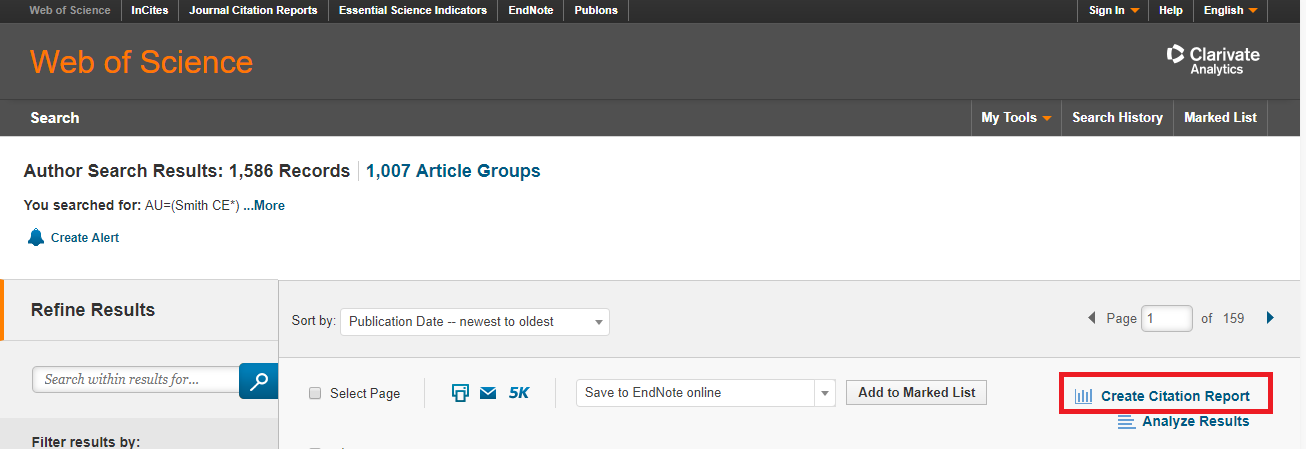
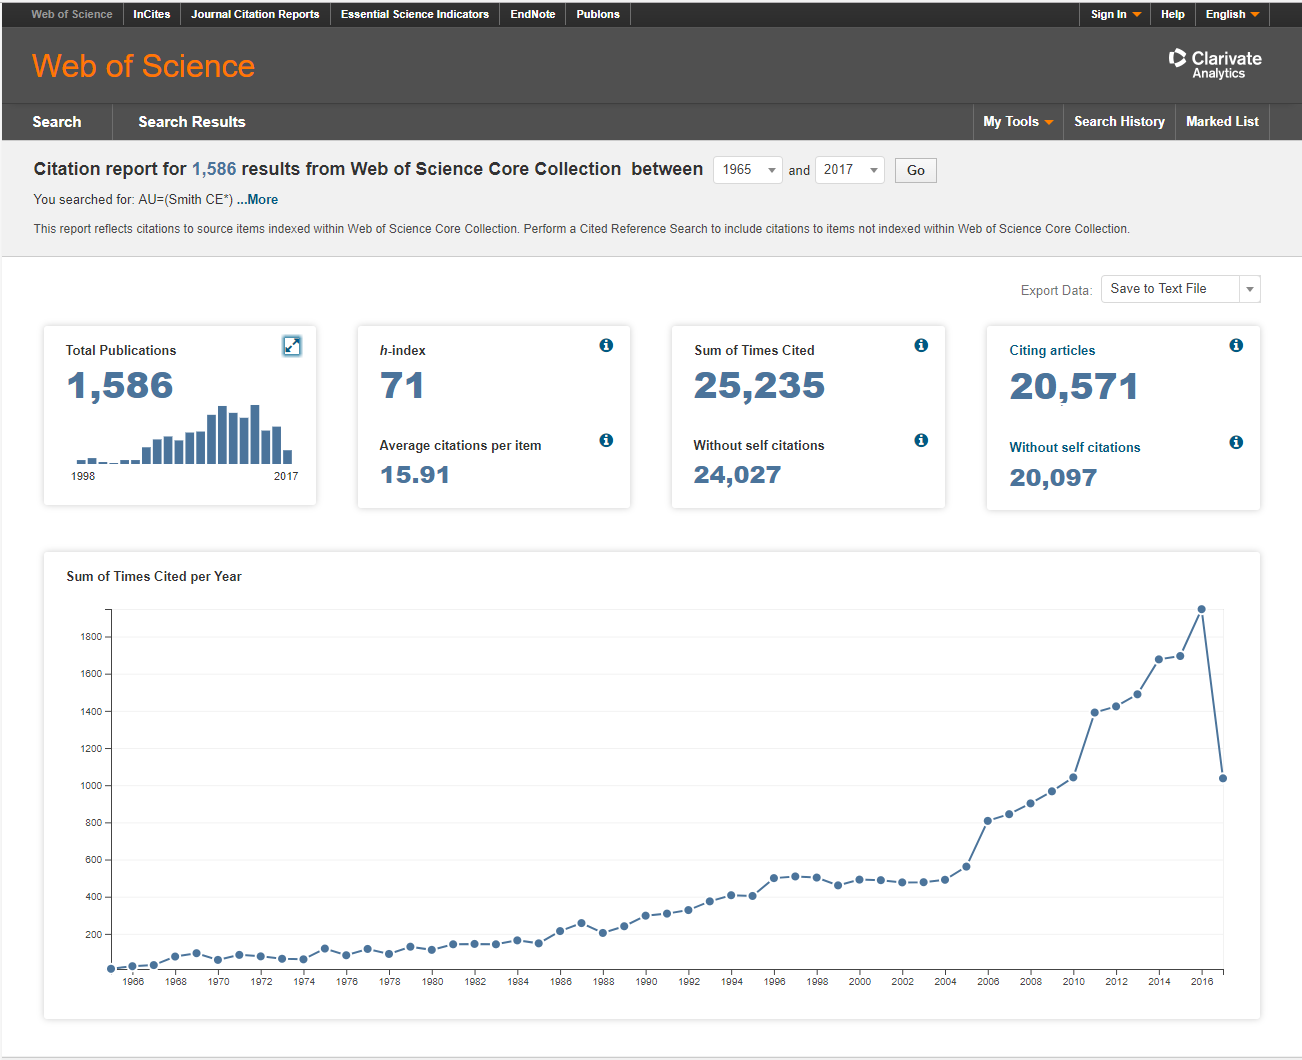
In Web of Science, use the Author Search tool to find all papers by an author or authors.


What metrics are you using as part of your research metric set? Is the individual and group h-indices ones you might consider including?
For additional resources, see:
- Article: Hirsch 2005
- Article: Which h-index?—A Comparison of WoS, Scopus and Good Scholar
- If you have questions about the h-index or calculating it using the Web of Science, contact the Alumni Medical Library at 617-638-4228 or refquest@bu.edu, or the Evaluation & Continuous Improvement Program of the BU CTSI at 617-638-5962.
By D. Fournier and D. Flynn