News
Digital Science Dimensions Badge
Do you know how many of your publications are scientifically influential?
BU Profiles now displays NEW metrics that show the influence of each of your publications using a NEW Dimensions citations badge.
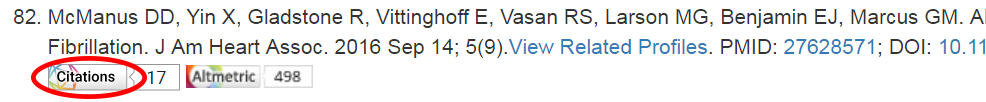
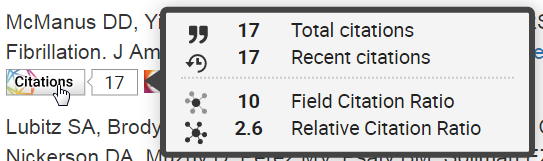
Hovering the cursor over this badge for each article also reveals its recent citations within the last two calendar years, its Field Citation Ratio and its Relative Citation Ratio.
You can use these metrics to compliment the previously added Altmetric badge, discussed here.
The NIH developed the Relative Citation Ratio to measure the scientific influence of an article in a specific field and use it as a benchmark against other NIH-funded award articles published in the last 2 years. It shows the citation impact (uptake) of an article relative to the average for NIH-funded articles. NIH now looks for influential articles (outcomes) associated with different grants and investigators. It provides agencies and study section members with supplemental information to assess proposals and their associated investigators. You can use it to make a case for your scientific influence with proposal submissions, honors and award letters and annual review and promotion. This is a better metric than Journal Impact Factor, which measures the importance of the journal, or citation counts, which are limiting because different fields cite at different rates, and rates go up and down in the time after a publication appears. The Relative Citation Ratio measures citations, but accounts for field differences through normalization and timelines of publications. A value of 1.0 means it has the same number of citations as the average (uptake as expected). A value of 2.0 means that a publication has twice as many citations as the average (uptake above average). If the article hasn’t been cited or is less than two years old a Citation badge will not be visible.
Use the Field Citation Ratio to make a case for your scientific influence:
The Field Citation Ratio metric indicates the relative citation performance of an article when compared to similarly aged articles in its Fields of Research (FoR) subject categories. The metric is normalized to 1.0 to the article’s FoR, which indicates that an article has the same number of citations as the average article (defined by its FoR subject code, publishing year and age). A value of 2.0 indicates that the article has a higher than average number of citations for its group. The metric is calculated for articles published in 2000 and later. Articles that are less than 2 years old will show ‘n/a’ as the FCR.
Clicking on the citation badge will reveal additional details on these four metrics and will enable you to view citing publications, the actual publication on the publisher site, and the citing research categories.
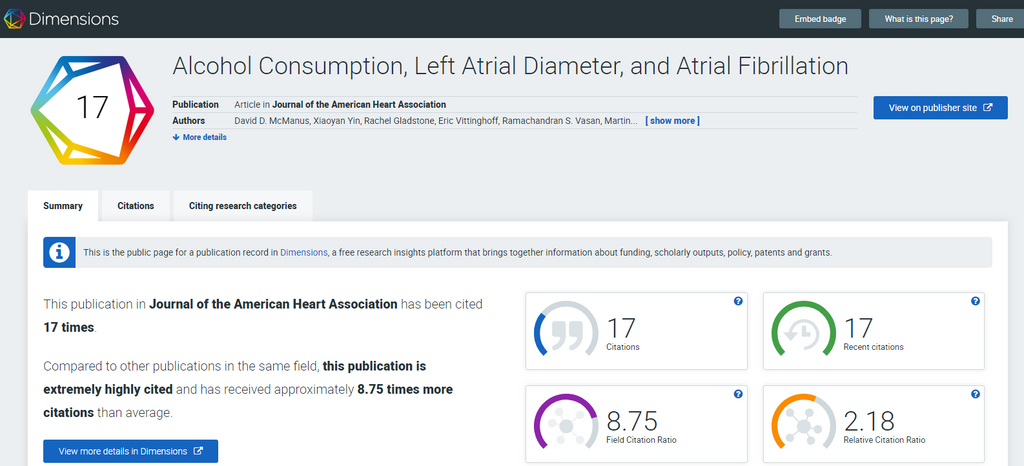
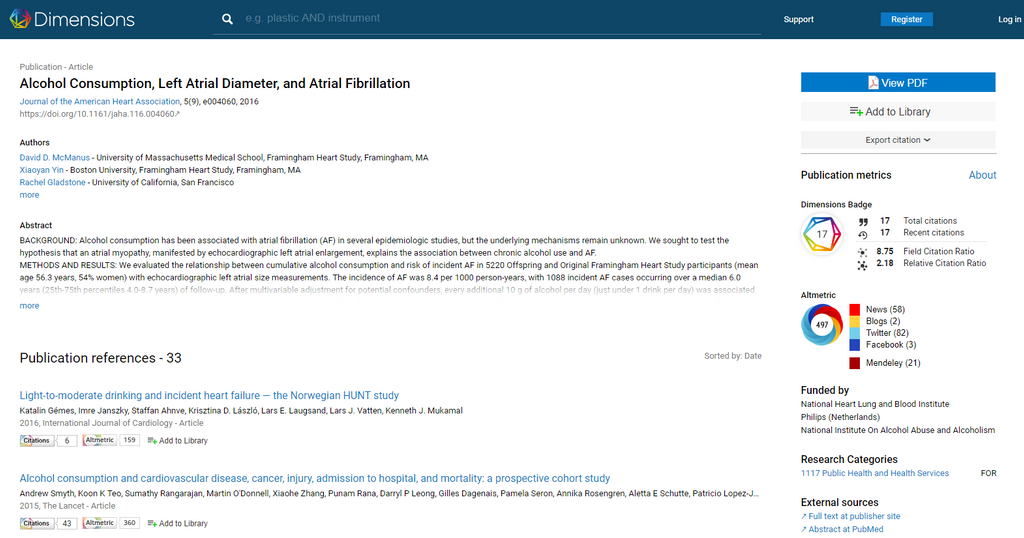
If you click the “view more details in Dimensions” button you’ll often get the abstract, publication references, the ability to view a PDF or add it to your own Dimensions library, funding information, external source links and various publication metrics.
In summary, faculty should be knowledgeable about how their scholarly contributions influence science in general, and in their respective fields specifically. This is particularly important now that NIH has begun assessing the outcomes of funded grants in terms of their success in generating influential work – which investigators publish more articles that are influential, and which have less. We believe that faculty who work in a culture of publish or perish must consider these new metrics, which provide increasing insight into their influence, and not merely their productivity.
To learn more, see these resources:
- NIH Perspective - Measuring impact of NIH-supported pubs with the Relative Citation Ratio
- RCR: A new metric that uses citation rates to measure influence at the article level
- The quiet rise of the NIH’s hot new metric
- NIH metric that assesses article impact stirs debate
- Citation Badge Announcement
- What is the Citation Badge Details Page?
- How the Field Citation Ratio is calculated
By C. Dorney, C. Shanahan & D. Fournier
Academic Networks
In the academic world networking was, and often still is, mediated through a mentor or other superior. Collaborative opportunities often come through mutual projects or existing networks already established through your mentor. Often these networks, constructed slowly over time through common work, can be narrowly focused on subject matter that may be limited in diversity and scope. It may miss the work and collaborative potential of a key professional right around the corner simply because they weren’t in your mentor’s network. This could be because their subject matter was not obviously related to your mentor’s. Lost opportunities for innovative and productive collaborations may have a significant impact on your research and career.
To address these lost opportunities, academia has begun to encourage networking among faculty and trainees to enhance innovation and collaboration to advance a new research paradigm - Team Science. Maintaining a personal network is extremely important to engage in the vibrant nature of Team Science. Academic relationships are dynamic, reflecting the diverse expertise and influence of all individuals, which in turn are always in flux. These factors are often rapidly changing, and in an unpredictable fashion. To manage this ever-changing academic environment, personal network management is a crucial aspect of one’s professional information management. It is the practice of managing multiple collaborative contacts and connections for social and professional benefits. If you can successfully tap key influential networks within your institution and wider academic discipline, you will be more likely to be nurtured toward success. In other words, it is not just what you know, but also who you know and can work with that matters in achieving academic success. Who you know may facilitate knowledge of essential methods and processes ranging from the science itself to accessing funding to “grantsmanship” to policy impact.
Building and Nurturing a Network
Although it may be easy to build a network by simply accruing a list of contacts, the real challenge is maintaining and leveraging those connections effectively. Information fragmentation can lead to difficulties encountered in ensuring co-operation and keeping track of different personal information assets (e.g. Facebook, Twitter etc.). Simply maintaining a contact list with accurate contact information (office phone, cell phone, email address, etc.) is a simple yet essential piece of maintaining a network. Devising and committing to a sustainable and organized approach to personal networking including the use of social media resources is becoming increasingly important to academic efficiency and success
Being Engaged in Interdisciplinary Team Research: Is Your Network Working for You?
If building and nurturing a professional network is requisite to being a successful academic researcher, then to catalyze and seize opportunities for interdisciplinary team-based research, the argument for Academic Networking couldn’t be stronger. Each academic has a professional network. Some build a deep network of people mostly in the same field, which can unwittingly limit potential interdisciplinary opportunities. Some build widely diverse networks using carefully selected individuals who can optimize their chances for interdisciplinary research. Others have made it a numbers game, focusing on the quantity of people and longstanding list of mentees in their network. But, have you taken a moment to look carefully at what kind of network you have? What strategies do you use to connect with others in a way that helps you harness opportunities for doing research in interdisciplinary teams? How many interdisciplinary research projects are you working on now?
Having a targeted and effective professional network can make the difference between working hard and working smart in the Team Science paradigm. Effective professional networking on-line can provide access to quick conversations, expert opinions, issues or systems scans. It can lead to new ideas, new connections and provide real-time insights about your research or your discipline. It can be an efficient way to find out what people in your network are doing and whether to reconnect with them. It can facilitate connections at conferences and meetings, open doors and build relationships with experts, influencers, and others key individuals.
If you don’t know the answers to or have never thought about these questions, consider taking some time to review, enhance and nurture your network. Your self-reflection should focus on “who” should be in your network – identifying those individuals who best facilitate your participation in team science. When considering your personal network, keep in mind that to be effective, your core connections and relationships should bridge smaller, more-diverse groups and geography. These relationships should also result in more learning, less bias, and greater personal growth by modeling positive behaviors: generosity, authenticity, and enthusiasm. Once you have defined your core network and how they relate to you and others within your network, consider who in your core can help with your professional and academic challenges. Is your core network group diverse enough and are you generating new ideas from this core? Are there people who take but don’t give? Should you continue your affiliation to them? Are there gaps in expertise, skill, support or availability?
The “benefits” of effective and well-curated networks that facilitates your ability to actively engage in team science include: 1. Communicating with peers and colleagues to keep informed and up to date about who is doing what; 2. To learn about new methods and tools people are using; 3. To create visibility for yourself that can help you develop a reputation (your brand); 4. To build career stability for yourself; 5. To move new ideas through the network and test it out; 6. To seek placement opportunities for your trainees – just to name a few.
Remember that the type, degree and targets for academic networking will evolve throughout the course of your career depending on your professional and academic needs. The Academic Network required by a trainee during transitions (e.g. new GMS student or Post-Doc) will vary. But what they all have in common is the absolute need to establish and nurture a well curated network of supporters and collaborators as they proceed within their academic field. Networking continues to be important even in mid to late career as ones needs and capacity to support others evolves. Each collaborator plays a different but critical role in the scientific enterprise. At times, special networks may be important based on other important commonalities. For example, for women, networking can be particularly challenging because attempts at networking requires self-promotion (which can be unfamiliar or uncomfortable for some), and can be misunderstood by others. Similar issues may exist for underrepresented minority researchers, and having a robust and supportive network can be invaluable to their success.
Effective networking is a critical yes often underestimated factor in establishing and sustaining a successful academic career in an ever-changing, increasingly more collaborative and competitive research environment. In a future blog post we will address a key personal networking activity – networking at a professional conference.
By C. Shanahan
LinkedIn SlideShare for Academics
Using LinkedIn SlideShare for Tracking and Assessing Your Research and Education Influence
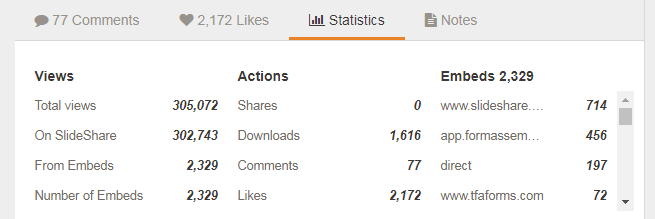
Faculty and trainees doing research should use a variety of metrics to track and assess his/her “research influence” using a mix of (1) traditional and (2) social media metrics (altmetrics). Likewise, faculty educators who develop instructional modules and innovative teaching models should also use metrics to show their “education influence”, such as adoption of education and evaluation materials and tools. LinkedIn SlideShare offers a way for researchers and educators to create and monitor an online digital footprint that can serve as one form of evidence of their scholarly contributions and overall impact. LinkedIn SlideShare is a social media slide hosting service that is broadly considered the world’s largest community for sharing professional presentations. It also allows sharing of documents (PPT, PDF, DOC, XLXS, etc.) infographics, videos and webinars. SlideShare is among the top 100 most-visited websites with 70 million unique visitors monthly, 38 million registered users, and 18 million uploads. It permits users to rate and comment, in addition to sharing uploaded content – akin to what YouTube does for videos. Below is a statistical activity report of the metrics for a given presentation, illustrating the potential reach a SlideShare presentation can achieve and the “uptake” metrics you can use for annual review and writing proposals and papers.
Users can upload files privately or publicly in various formats, such as PowerPoint, PDF, Keynote, and OpenDocument presentations. Slide decks can be viewed via their website, on hand-held devices or embedded on other sites. In most cases slides being viewed can be downloaded in PowerPoint or PDF format.
Created in 2006 and acquired by LinkedIn in 2012, SlideShare was originally intended for business users but rapidly expanded to other topics. It has an extensive collection of clinical and medical research presentations under “Health & Medicine,” and now has nearly 40 different content categories in more than 50 different languages.
SlideShare claims to allow people to “learn faster” by flipping through slide decks from experts on a given topic instead of scrolling through pages of text. Over 80% of SlideShare visitors come through targeted search, meaning the content you share is more likely to gain attention from those directly seeking your expertise and advice, which increases the chance that a collaborative professional relationship may form. SlideShare also makes it much easier to see what is being taught and help you to prepare to teach. One can review a few slide sets quickly to see how others have approached a specific topic and then use that understanding to create your own slide set for that upcoming talk. Teaching curricula or training videos could be posted for a variety of uses by others. SlideShare can even serve as a free multimedia content distribution platform with little to no overhead.
It is fast and easy to Connect SlideShare to your BU Profile to showcase your accomplishments, knowledge and expertise. To do so it’s as simple as adding your SlideShare website (for example, http://www.slideshare.net/richardwainford). To set this up for yourself, go to your Profile and login in and edit the “Websites” item from the main edit screen, or just request help and request it be added. Once done, the slides show in Profiles on the Social/Media menu (see below). You can also add SlideShare to your LinkedIn profile.

Within SlideShare you can search for content and authors who create it. When giving a lecture on a research or a clinical topic, you might want to use SlideShare to see how others approached the topic. You are likely to be surprised by how much content is in SlideShare. The table of random search strings below illustrates the impressive number of slide sets linked to each.
| Search String | # of Slide set hits |
| sickle cell anemia management & treatment | 3,467,474 |
| non-epileptic seizure disorders | 1,777,388 |
| Medical ACO | 797,033 |
| resident surgical evaluation | 735,183 |
| gaucher disease | 407,484 |
| iPS Cells | 285,068 |
| drug eluting stents | 264,628 |
| chronic traumatic encephalopathy | 175,708 |
| geriatric depression | 130,706 |
| parathyroid tumors | 29,732 |
| preeclampsia-eclampsia | 3,901 |
| Metabolomics | 1,575 |
| Bronchiectasis | 1,287 |
| CRISPR | 682 |
| Biorepository | 169 |
| SBIRT (Screening Brief Intervention and Referral to Treatment) | 163 |
| i2b2 | 110 |
| Chikungunya | 30 |
So take a few minutes to explore SlideShare and consider its benefits in adding to your BU Profile. SlideShare offers you a convenient way to widely share your expertise directly with individuals who are seeking such information to possibly adopt and/or adapt to what they are currently using. You don’t need to register to search and view content. A few minutes searching for content that piques your professional interest is often quickly rewarded. By posting your own work you not only inform the academic and research community on your expertise, you also support the academy and your colleagues in general. SlideShare has the potential to drive tremendous traffic to your site. Possible outcomes include: being contacted to provide this or a related presentation, asked to serve on a committee, getting recruited for a position or sought out as a research collaborator. You’ll never know unless you get your content out there!
For additional resources, see:
- Creator’s Hub: Resources to create standout SlideShare presentations that get you noticed
- Featured SlideShare content highlighting some of the best presentations
- The Kissmetrics Blog: A Marketers Guide to SlideShare
- An interesting discussion on using SlideShare to generate traffic from a small online business owner
By C. Shanahan
Is the h-index right for you?
Author-level metrics that investigators could select include total publication count, first-author publication count, and median and mean citations per publication. Remember that the mean citation per article metric can be significantly skewed and the median citations per publication metric can be low, due to a long tail of papers that are cited a few times, or not cited at all.
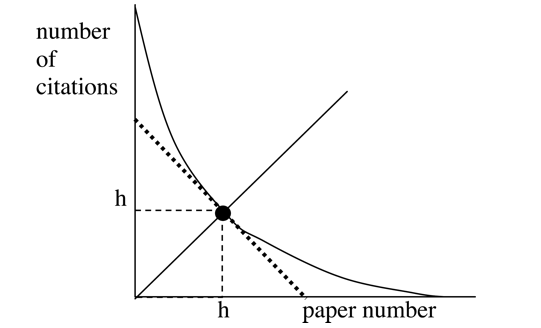
The author’s h-index was designed by physicist Jorge Hirsch in 2005 to address the limitations of citation-focused metrics by creating one easy to understand number that indicates both research productivity and influence. Specifically, it represents the intersection of the number of publications written by an author and the number of times those papers have been cited. For example, an h-index of 12 means the author has 12 publications that have been cited 12 times. It is based on the set of most cited papers and the number of citations in other publications. It also discounts the disproportionate weight of highly cited publications or those not yet cited.
Key questions that many investigators need to answer are: “What is my research influence based on my productivity and the uptake of my work by others? How do I compare to my colleagues in the same field and at same career stage?” The h-index helps to answer the questions. For these reasons, the h-index is the most discussed and most influential metric developed in the past ten years. However, it also has some weaknesses. For example, the value of what is considered to be a “good” h-index varies greatly from discipline to discipline - a world-famous economist might have an h-index of 7, whereas an equally accomplished physician-scientist publishing in medical journals could be near 100. Additionally, the h-index has not been systematically calculated for large disciplinary groups using a standardized method so it cannot be used to benchmark. Also, since the h-index accounts for the total number of citations for the total number of articles, it favors more established scientists who are further into their careers, as opposed to younger or mid-career researchers. Therefore, an h-index should not be used to compare individuals in different fields/disciplines since indices vary by subject and disciplines have different citation practices, nor should a postdoctoral trainee be compared to a mid-career investigator in the same field. The h-index should only be used to compare two individuals in the same discipline at the same stage of their development. Further, the index can vary by the databases and time span used; an h-index calculated from Web of Science will be lower than that from Google Scholar. Only publications in a particular database are counted, thus books and conference proceedings that are underreported in a database (compared to publications) will be excluded from the calculation.
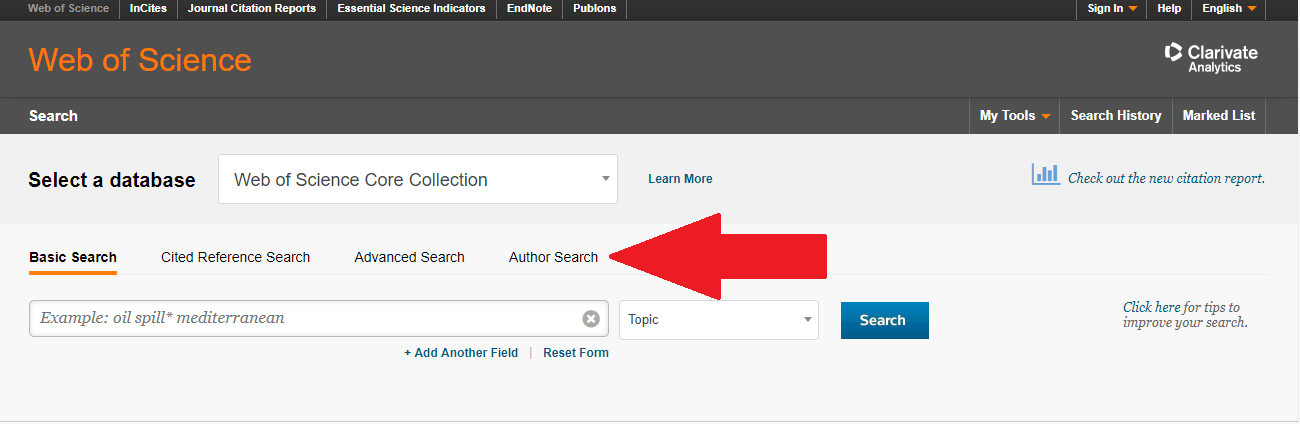
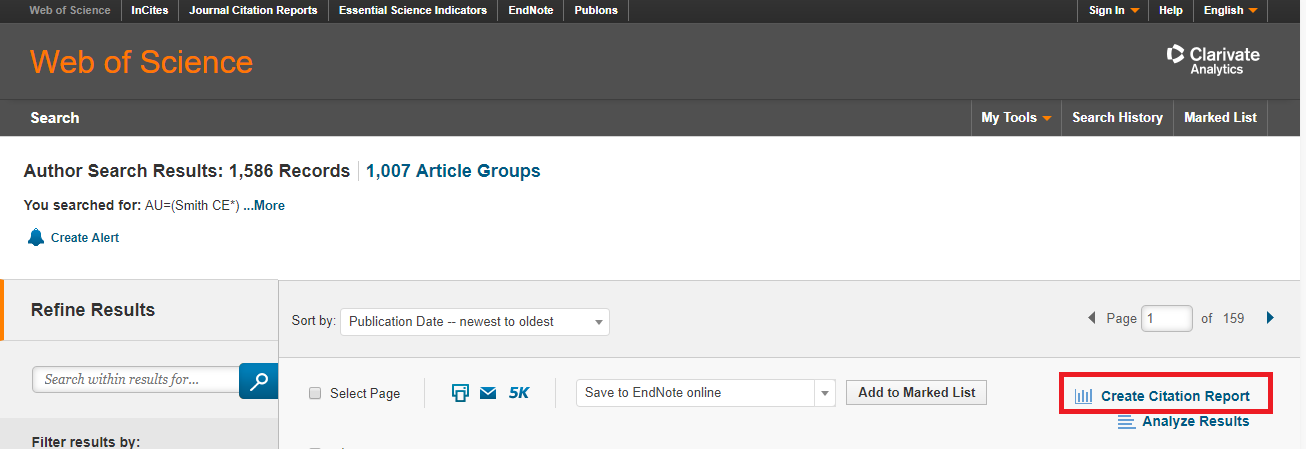
In Web of Science, use the Author Search tool to find all papers by an author or authors.
What metrics are you using as part of your research metric set? Is the individual and group h-indices ones you might consider including?
For additional resources, see:
- Article: Hirsch 2005
- Article: Which h-index?—A Comparison of WoS, Scopus and Good Scholar
- If you have questions about the h-index or calculating it using the Web of Science, contact the Alumni Medical Library at 617-638-4228 or refquest@bu.edu, or the Evaluation & Continuous Improvement Program of the BU CTSI at 617-638-5962.
By D. Fournier and D. Flynn
Altmetrics
Daily, Alternative Research Metrics (Altmetrics) are generating real-time evidence of an investigator’s research influence through social media. Alternative Research Metrics help you as an researcher to better understand how and where your scholarship is being discussed, shared, integrated, and adopted by scholars and, most notably, the public. It is this public engagement information that universities and funders are increasingly asking researchers to become aware of and document as part of their research activities. While these new metrics have their critics, it is our hope and expectation that understanding and taking advantage of the strengths these metrics will lead to improved metrics and clarity on their use in academics. Have you looked at what tracks you have been making lately?
Most reserachers understand that publications and citations are laboriously slow to accumulate. Used alone, they may provide only a narrow view of the value of your activities. As research content is routinely disseminated, discussed, shared, recommended, or otherwise used online, researchers now have access to immediate feedback on the reach and influence of their work.
Every day, researchers broadcast scholarly influence in “trackable” forms such as slide presentations, papers, datasets, banks/repositories, training materials, scholarly tweets and blogs. Reference companies like Mendeley, CiteULike and Zotero are making a business out of data collection via social media to track and report the influence of researchers’ work. Scholarly debates about the current hot paper, once confined by academic walls, is now blasted across the web. These “tracks” researchers make are called “Alternative Research Metrics,” or “altmetrics.”
In BU Profiles, Altmetric Attention Scores are displayed on many publications, which link to a details page showing the source and geographical breakdown of activity, allows you to subscribe to alerts and other details.

One of the highest rated attention scores in 2015 came from this publication with contributions from BU authors. The BU library is showing altmetrics on many of the articles found in BU Library Search, as will a new tool called My CV, available soon at BU.
An Altmetric Badge (the “donut”) displays different colors that correspond to the source of content. Twitter activity shows as blue, news outlets as red and public policy as purple. Sources are weighted differently—an international news outlet contributes more than local news, which contributes more than a blog post, which contributes more than a tweet. More mentions equals a higher score, but the method matters, too. An academic peer like a physician-scientist mentioning an article to many other academic peers counts much more than a journal pushing out the same article automatically; a person with a verified social media account with thousands of followers counts more than an unverified account with five followers. Twitter Favorites and Facebook Likes are not included because that activity is easy to purchase/manufacture. Some important sources are not counted because they are not broadly transparent — Mendeley readers, Scopus citation counts, publisher embargo-restricted pubs, etc.
It is also important to note that there are limitations with altmetrics, for example, it is a relatively new metric and currently only focused on English language sources. The metrics are only quantitative, and while they suggest the volume of attention being paid to certain research, manual effort is required to assess the underlying qualitative data (who is saying what about the research). While altmetrics can easily identify trending research, it is still unknown if they closely correlate with long-term impact but predictive analytics are being developed. For now, blending traditional research metrics with altmetrics seems a wise approach to identifying metrics of influence for researcher CVs and funding proposals. To learn more, see these resources:
- A beginner’s guide to altmetrics video;
- Jason Priem (UNC-Chapel Hill) coining the term “altmetric” in a thought-provoking article;
- A guide to including altmetric data in your NIH Biosketch;
- Altmetric’s sources (this is a digital science company founded in 2011 around altmetrics).
- Altmetric’s blog – better management decisions by combining traditional metrics and altmetrics.
- BU Profiles “what’s new” section.
By C. Dorney and D. Fournier
A New Blog at BU — Research Networking
Welcome to the BU Research Networking Blog.
As Faculty Lead for Research Networking (RN) at BU, I have started this Blog to educate people by sending out occasional posts about the new and exciting RN activities at BU and in the scientific community.
If you are new to Research Networking then you might be interested to learn that Research Networking commonly employs online applications to discover and use research and scholarly information about people and resources. RN applications, also know as tools (RN tools), serve as knowledge management systems for the researchers regardless of whether the researchers that use them work in academic institutions, foundations, government, or in industry. RN tools connect institutional systems, broad research networks, public research data, and restricted data by collecting accessible information from a wide range of sources and then aggregates and organizes the information as expertise profiles for faculty, investigators, scholars, clinicians, community partners, and facilities. RN tools help people find and create new collaborations and enable team science to address new or existing research challenges by making information about researchers, expertise, and resources rapidly accessible and searchable.
BU has its own Research Networking system called BU Profiles which I urge you to check out. I will writing about this excellent free resource for BU faculty, Industry Partners, and the Academic community at in this Blog.
The VIVO Standard
Electronic Research Networking (RN) tools use a variety of approaches to structure, organize, display, and share core data about individual researchers obtained from a wide range of sources. One example is VIVO, which was first devised, developed, and implemented at Cornell, but more importantly, it is an open source semantic web platform which has evolved to be the de facto standard for RN Tools. The VIVO standard enables RN information to be accessible through locally controlled standardized search and browse.
A key reason for popularity of VIVO as a standard is that it employs the Resource Description Framework (RDF). RDF captures and permits attribution of meaning to the relationships between various academic resources (e.g. researchers, institutions, published papers, etc.). This qualifies VIVO as a semantic web application and enables it to engage in discovery of research and scholarship across disciplinary and administrative boundaries using interlinked profiles of people and other research-related information. For example, the RDF not only captures that Researcher A and B are both listed as authors on the same paper but more importantly these individuals are now considered co-authors. Now one can now surmise that they have collaborated at least once in the past. However with repeated instances of co-authorship noted between these two individuals, one could then infer with increasing certainty that these researchers are not only co-authors but in fact active collaborators.
A VIVO compliant online RN tool, such as BU Profiles, is populated with researcher contact information, interests, activities, and accomplishments and enables the discovery of research and scholarship across disciplines both internal and external to the local institution. Individuals are able to highlight their areas of expertise, display their academic credentials, visualize academic and social networks as well as display information such as publications, grants, teaching, service, and more. Local content can be maintained manually or be automatically populated from various authoritative data sources including Human Resources, institutional records, local repositories / databases (bibliographic, grants, course, and faculty activity), as well as from other data providers such as publication aggregators and funding agencies.
The VIVO software, architecture, and ontology are publicly available along with content that supports implementation, adoption, and development efforts. VIVO compliant applications exist both as free (VIVO, BU-Profiles, Profiles RNS, Loki, Lattice Grid) as well as proprietary (SciVal Experts, Research in View, etc.) applications. The VIVO ontology, developed and supported by NIH-funds, continues to be developed through SouceForge and collaboration with eagle-i.