2021 Diversity, Equity and Inclusion Audit
In Fall 2021, the Gastronomy Program at BU launched its first diversity and inclusion audit. We did this as a first step in working towards a more diverse, inclusive and equity-promoting program because we believe that our program can not be truly excellent until it is truly inclusive and promotes equity.
For this first audit we focused on four elements:
- Student diversity
- Faculty diversity
- Scholars/Writers assigned in classes
- Invited guest speakers
We collected data for these elements from Spring 2020 through the end of Spring 2021.
One challenge for collecting this data has been how to define diversity and inclusion. To begin with, we focused on groups who have historically been under-represented in Food Studies. Anecdotally (no data has been collected) Food Studies has been a very white field. The work of white scholars has predominated on syllabi and at conferences and the majority of faculty and students in Food Studies programs in the US have been white. Therefore, we began by trying to determine how much this pattern has been replicated in the Gastronomy program.
- We requested data from our Enrollment management services to determine student demographics.
- We requested data from our Human Resources department to determine faculty demographics.
- We requested faculty to self report percent of readings they assigned by people of color and percent of guest speakers who were people of color.
These requests are limited in that they do not collect any data about disability status or sexuality, categories for which it can be difficult to collect data. Moving forward we will look for ways to audit our inclusiveness in these and other categories.
This report was prepared by Program Director Megan Elias, Assistant Director Barbara Rotger, and Graduate Program Assistant Elizabeth Weiler.
Results:
Student Diversity: MET Enrollment Management provided student demographic data for the Fall 2020 and Fall 2021 semesters. The data does not show much change in distribution of racial identification. Approximately two thirds of Gastronomy students identify as white. This number is complicated slightly by the inclusion of “non resident alien” among racial categories distinct from white. The percent of students identifying as white is slightly higher than the percent of the population at large who identify as non-Hispanic white (57.8%). Approximately 6% of students identify as Asian, which is the same as in the general population. While approximately 12% of the general population identify as African American or Black, only about 4% of Gastronomy students do so. And while about 8% of students identify as Latino, this is less than half the national figure of nearly 19%. MET does not appear to collect statistics on indigenous identity.
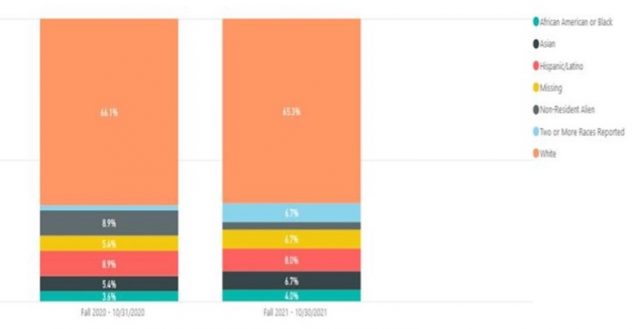
We are missing data on the identity of approximately 5% of our population.
Faculty Diversity: MET’s HR department provided demographics on full-time and part-time faculty who have taught for the program. Of the 24 faculty we have data for, 10 listed “white” as their race, one listed two or more racial categories, indicating asian/white. The remaining 13 faculty did not indicate a race.
Scholars/Writers Assigned In Classes & Invited Guest Speakers: Faculty who teach in the Gastronomy Program were asked to report the racial identity of authors whose works were assigned as readings in their classes, and as well as the identity of invited guest lecturers.
| Semester | Average % of BIPOC
authors |
Average % of BIPOC speakers |
| Spring 2020 | 16.4% (out of 8 reported) | 33% (out of 1 reported) |
| Summer 2020 | 1% (out of 2 reported) | 0% (out of 1 reported) |
| Fall 2020 | 22.7% (out of 9 reported) | 40.4% (out of 7 reported) |
| Spring 2021 | 18.7% (out of 8 reported) | 27.7% (out of 3 reported) |
| TOTAL | 14.7% (out of 27 total reported) | 25.3% (out of 12 reported) |
Conclusions and Next Steps:
The Gastronomy Program needs to develop inclusive recruitment strategies, with a focus on increasing the number of Black, Latino and Indigenous in the prospective students and applicant pools.
- When opportunities arise, the program should prioritize inclusivity in hiring.
- Summer course offerings in particular need attention to promote inclusivity in readings assigned and guests invited.
- Guest speaker invitations are relatively inclusive in terms of race/ethnicity, but we have no data for the categories of disability and sexuality.
- The program would benefit from a workshop in creating inclusive curricula.
Relying on faculty reporting for data on assigned authors and guest speakers resulted in incomplete results. This indicates a need to implement an improved system to track this data. Future audits could be expanded to include review of course Blackboard websites and assessment of their inclusiveness.
The exercise of preparing this report is a valuable first step in the work of establishing a more diverse, equitable and inclusive food studies program at Boston University, and will serve as a baseline for annual updates.