News
Congratulations to Pierre Boucher for defending his Master’s thesis
Pierre Boucher presented his work on how urgency alters pre-stimulus state and defended his master's degree with aplomb! Congratulations Pierre!
Our multi-area RNN paper is now accepted at NeurIPS
Our paper on multi-area RNNs as a model for understanding perceptual decision-making is now accepted as a full paper at the NeurIPS conference.
WaveMAP is now in press at eLife
Nicole Carr, and Tian Wang from the BME department have joined the lab.
Analyzing extracellular waveforms with non-linear dimensionality reduction
My name is Nicole Carr. This is my first semester as a graduate student at Boston University in the Biomedical Engineering Ph.D. program. I wanted to rotate in Chand’s lab to dive into the world of computational neuroscience and gain experience working with monkeys as a model organism for behavioral research and neural engineering.
I began by learning about UMAP, a new technique in machine learning for dimensionality reduction for visualizing large, multidimensional data sets. Extracellular waveform recordings are most often classified into narrow and broad spiking neurons. However recent research has shown that the UMAP algorithm is able to reveal more diverse waveform features in rhesus macaques. Using WaveMAP, an algorithm developed in the Chand lab to combine UMAP and graph clustering for waveform analysis, I analyzed waveform data collected by Dr. Economo’s lab from layer 5 pyramidal tract (PT) neurons in mice.
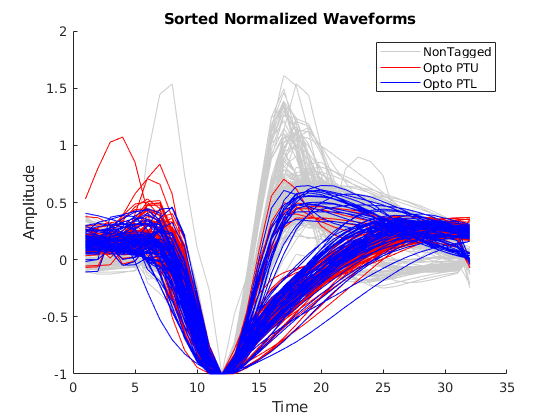
I created a MATLAB program to extract high-quality waveforms and separate relevant features including the optogenetic tagged PT upper and PT lower neurons. Notice the optotagged PT upper neurons (red) and the PT lower neurons (blue) with very distinct waveform shapes compared to the untagged waveforms (grey). After extracting this data set, I used WaveMAP to cluster the waveforms. The algorithm found three clusters containing seven distinct waveform shapes as seen in Figure 2. Figure 3 describes the same clustering separated into categories of optotagged PT upper neurons (red) and PT lower neurons (blue). It is notable that no untagged waveforms were found in the tagged cluster. I also used this algorithm to explore the AllenBrain Institute neuropixel spike data set. By working on these computational analysis projects, I was able to greatly refine my coding skills in MATLAB and Python.
During my rotation, I was also able to learn protocols that are necessary for monkey lab work. Before I was able to come into the lab, I completed several online, then in-person training as required by IACUC and ROHP for involvement in non-human primate research. After much observation throughout my time in the lab, I became more familiar with the monkeys as well as procedures for chairing and behavior training. I also worked on a small project for the rig to record how much juice/water is consumed by the monkey during a behavioral session.
I designed and built an electronic circuit that would display this amount in real-time on an LCD using a continuous fluid level sensor in the juice bottle. The fluid level sensor outputs a variable resistance which is inversely proportionate to the liquid level. Using a microprocessor, I converted the resistance into a measure of volume remaining in the juice container. This was programmed on an Adafruit Metro (compatible with Arduino)using C++.
Modeling Urgency Signals in Dorsal Premotor Cortex
My name is Liam Sennott, and I am a rising senior at Boston University. I am a neuroscience major and a computer science minor. I worked in the Chand Lab remotely in the Summer of 2020 through Boston University’s UROP program.
For my project, I created a mathematical model to help explain “urgency” signals in the dorsal premotor cortex (PMd). I did all of my work using MATLAB.
The dorsal premotor cortex (PMd) is a brain area implicated in perceptual decision making. Prior work has shown light on how this brain region processes sensory evidence related to decision making. However, how an internal state such as urgency affects the decision making process and how it manifests in this brain region is currently unclear.
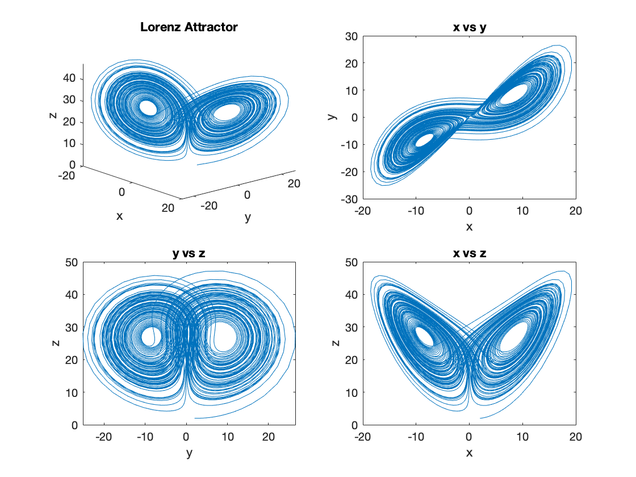
In order to tackle this project, my goal was to build a model in MATLAB based on a recent study of decision-making done by Peter R. Murphy and his collaborators (Nat. Comm. 2016); this model would be adapted to test possible sources of urgency in PMd. To start, I implemented a simple “Lorenz attractor” system in MATLAB, which taught me the fundamentals of solving differential equations in MATLAB. The following figure displays the output of the solved Lorenz attractor system.
From there, I began working on building my model. The model assumes that decisions emerge from a competition between two accumulators that integrate evidence for each choice over time. The accumulator that wins the competition is the decision generated by the model. The model contains a baseline input as well as a gain multiplier on the evidence for each choice. I chose to investigate two hypotheses on the source of urgency in PMd: 1) urgency is related to initial input on this brain region 2) urgency is related to level of gain.
After testing the effects of altering baseline input and gain levels, I found that the latter had a more dramatic effect on the choice selective signal. When baseline gain increased, the choice selective signal increased more rapidly (see figure below).
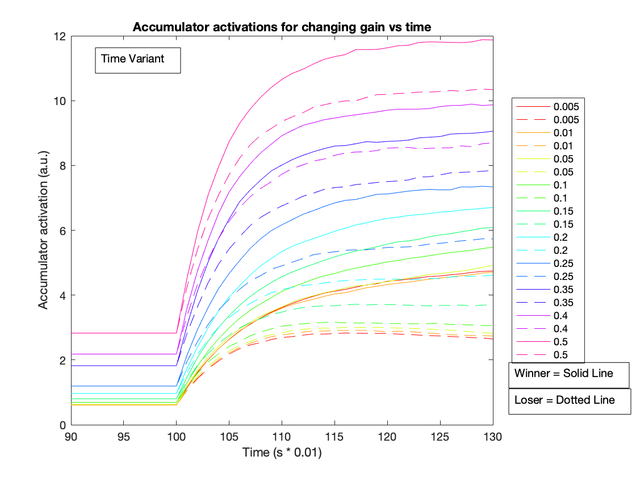
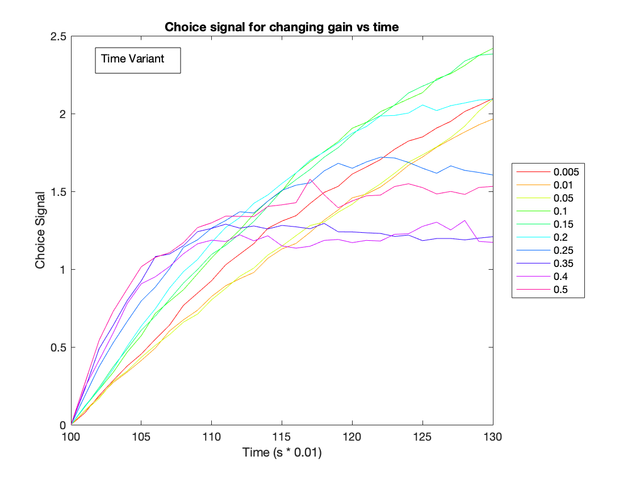
These two figures show that a notable difference between the decision accumulator arises as gain levels increase (right), but this isn’t the case for an increasing current (left). This suggests that the gain parameter could be emulating an urgency signal.
During my two months of work this summer, I learned much about the process of using MATLAB to solve differential equations as well as using a model to experiment with a simulated system. I also refined my MATLAB programming knowledge and ability to produce quality plots. Finally, this project was met with some difficulty, due to it being conducted remotely. However, I am grateful to have had the opportunity to perform a research project from home.
Modeling neural activity: from cells to laminae to brain areas
My name is Morgane Butler, I am a first year PhD Student rotating in Chand's lab (remotely!) for the summer. I began the project with no experience in MATLAB and little experience in computational neuroscience. My hope was to improve my MATLAB skills and that I did!
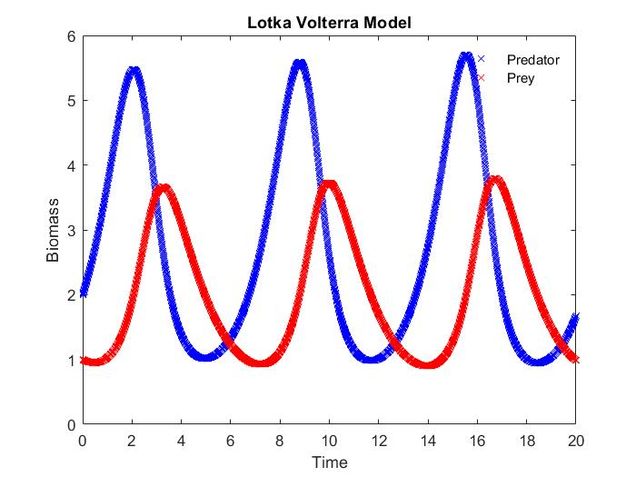 Dr. Chand had me start out with a simple model of Predator-Prey interactions called the Lotka-Volterra model. I used this exercise to understand important MATLAB basics and created an Euler method solver for the system of differential equations representing the model.
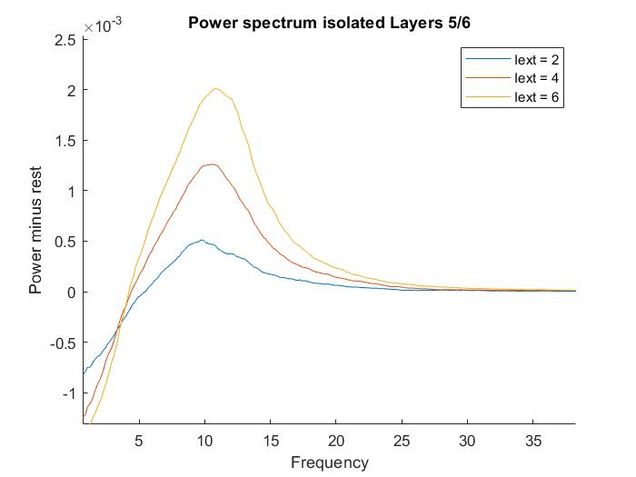
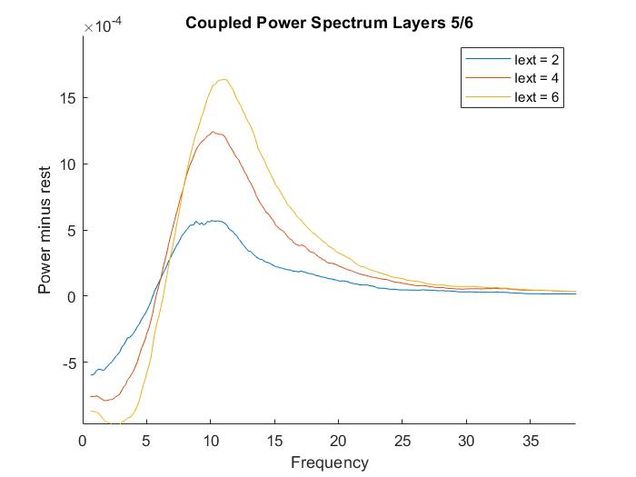
Next, I turned to Feedforward and feedback frequency-dependent interactions in large-scale laminar network of the primate cortex (Mejias et al. 2016). Based on empirical data this paper creates models of neuronal activity across layers of the cortex and scales it up to feed forward and feedback connections across brain areas such as V1 and V4.
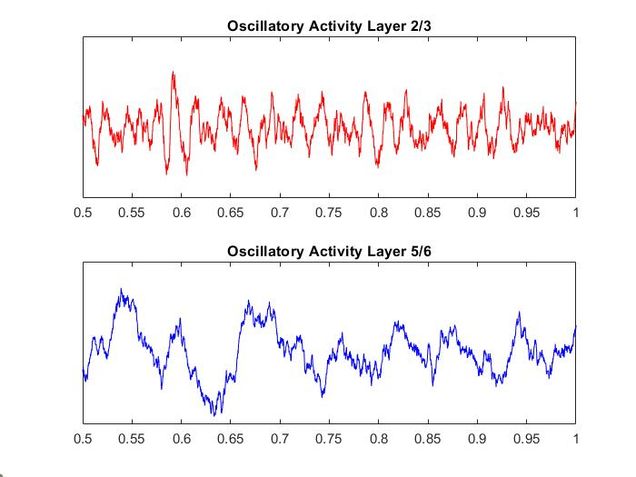
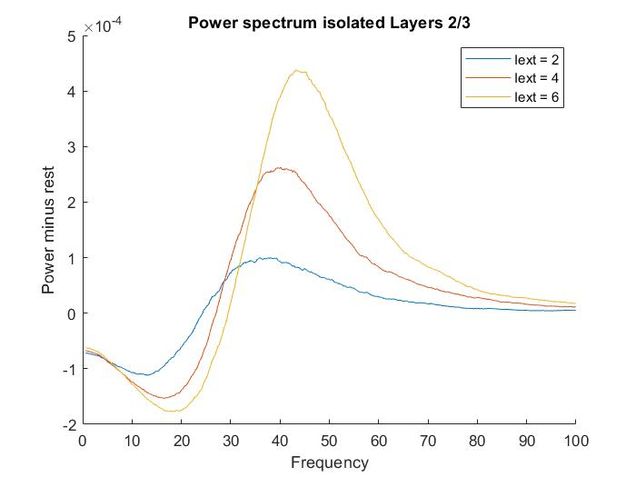
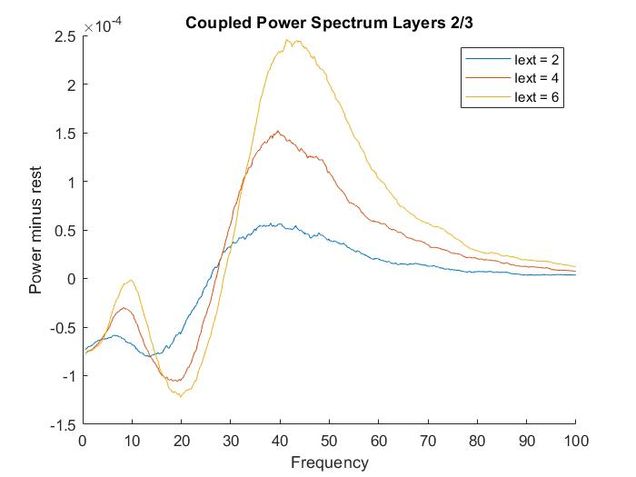
Using my code from my Euler method solver and the differential equations provided in the supplementary materials, I recreated the models of oscillatory activity, as seen to the left. With a bit of troubleshooting and Dr. Chand's advice, I also conducted a power analysis of the oscillatory activity using a multi taper analysis from the Chronox MATLAB toolbox (http://chronux.org/). By modulating external inputs to the "neurons" I was able to show the behavior of the model in various conditions and across anatomical scales. I was able to first build E-I models that replicate the high-frequency oscillatory activity in Layer 2/3 and low frequency oscillatory activity in Layer 5/6 from the paper. I then scaled it up to connect supragranular (above layer 4) and infragranular (below layer 4) layers. Finally, I connected area V1 to area V4 accounting for anatomical feedforward and feedback projections between the areas. Notice in the power spectrum of connected layer 2/3 (top right, below) we see an emergence of activity reminiscent of layer 5/6 in the 3-12 Hz or alpha band.
Thoughtfully creating models such as this one allows us to form and develop hypotheses when we do experiments in the wet lab. If you are interested in looking deeper into my code and reading a more complete write-up please refer to my GitHub.
I can now confidently say that MATLAB is something I will use in my near future and I had a great time learning this new skill and growing as a scientist in the Chand Lab!
Dimensionality reduction for neural data analysis
My name is Munib Hasnain and I am a first year PhD Student in the Biomedical Engineering Department at Boston University. I rotated in the Chand Lab during April and May 2020 where I learned about and applied dimensionality reduction techniques to neural data.
Advances in recording techniques have enabled neuroscientists to record activity from large populations of neurons simultaneously. This has enabled researchers to formulate population-level hypotheses and has opened up the sorts of analyses that can be performed. One form of analysis is dimensionality reduction, in which we seek low-dimensional representations of high-dimensional data - the idea being that there may be shared activity or mechanisms among a population of neurons that can describe the entire population. Dimensionality reduction methods extract these explanatory or latent variables and discard unexplained variance as noise. There are many methods to perform dimensionality reduction, but not all are suitable for neural data. During my rotation, I applied four different methods to understand their applicability to neural data and to get a sense of what it takes to implement them.
The first method I looked at was Principal Component Analysis (PCA). PCA seeks to find the direction of maximal variance in a dataset. All principal components are orthogonal to each other and are simply the eigenvectors of the data covariance matrix. Dimensionality reduction is achieved by projecting the original data onto some number of the principal components found through PCA. Although PCA is a powerful technique, it is generally only applied to trial-averaged data as it does not have a noise component. The lack of a noise model hinders the technique's ability to capture the true dynamics of the neural population, since neurons may contain both shared and independent variance.
Factor Analysis (FA), on the other hand, can be thought of as similar to PCA, but contains an implicit noise model that is capable of separating the shared variance of neurons from the independent variance, thus making it more suitable to single-trial data analysis. The goal of applying PCA and FA are exactly the same, but FA has been explicitly designed to identify latent variables, whereas PCA provides an approximation to those latent variables.
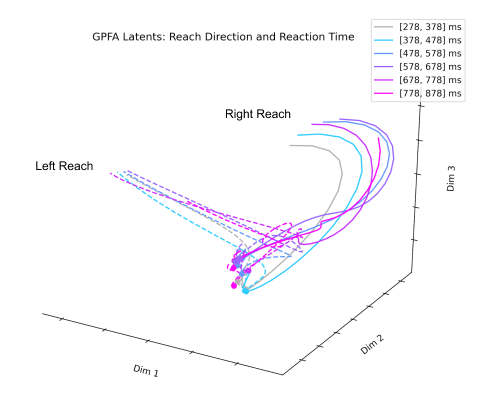
The next technique I looked at was Gaussian Process Factor Analysis (GPFA). When applying PCA or FA to neural data, the data must be smoothed over time before dimensionality reduction. GPFA combines both smoothing and dimensionality reduction into a unified process in order to ensure that both the degree of smoothness and the relationship between latent and original activity are optimized together. GPFA has been applied extensively to neural data and seems to be one of the more popular techniques for extracting latent neural trajectories.
Lastly, I looked at Variational Latent Gaussian Processes (vLGP). This technique is similar to GPFA in that smoothing and dimensionality reduction are combined into a single process. vLPG differs from GPFA in that it assumes neural spiking to be follow a point process, which can be seen as preserving information between firing rate bins that may be lost in techniques such as GPFA. Both GPFA and vLGP are suitable for single-trial neural data analysis.
My time in the Chand Lab was extremely valuable and I hope to be able to continue learning and applying large-scale neural data techniques to answer interesting questions about behavior and motor control. If you are interested in seeing the implementation of these techniques to both simulated and real data, you can find my code on GitHub.
openEyeTrack – A high speed multi-threaded eye tracker for head-fixed applications
Check out our new tool, openEyeTrack, a low-cost open-source high-speed eye tracker for tracking eye position in head-fixed applications. This was a summer project for a talented undergraduate in the lab, Jorge Paolo Casas. We were able to architect a multi-threaded eye tracker using OpenCV, Teledyne DALSA Camera, and C++. We are currently running behavioral experiments to validate the eye tracker for general use in psychophysical experiments and to derive estimates of accuracy. Work inspired by this oculomatic paper by Jan Zimmerman et al.
- Paper is available here:

- Code is available here.
- The archived V1.0.0 version of the software is available on Zenodo.

References
Jan Zimmermann, Yuriria Vazquez, Paul W. Glimcher, Bijan Pesaran, Kenway Louie (2016), Oculomatic: High speed, reliable, and accurate open-source eye tracking for humans and non-human primates, Journal of Neuroscience Methods, 270, 138-146,
ChaRTr – An R toolbox for modeling decision-making behavior
If you are interested in arbitrating between DDMs, urgency gating or collapsing boundary models to describe the behavior of observers in perceptual decision-making tasks, then check out our paper (ChaRTr paper) and accompanying toolbox (github.com/mailchand/CHaR).