Simulating Mid-century Climate Impacts on New York City’s Energy Demands

Project Partner: New York City Mayor’s Office of Climate and Environmental Justice
Project Summary: Simulating mid-century climate impacts on New York City’s energy demands, Summer 2023
In New York as in many cities, climate change is expected to shift the distribution of extreme heat events by making them more frequent and intense in the long run; thus, increasing electricity demand to cool spaces in the summer. Simultaneously, global warming will moderate cold-season low-temperature extremes, reducing the demand for space heating during the winter. Climatically driven energy costs/savings are likely to accrue more to some urban sectors and boroughs than others, thus asymmetrically increasing New Yorkers’ vulnerabilities.
Nicolas partnered with the New York City Mayor’s Office of Climate and Environmental Justice to project these changes on the city’s energy system circa-2050. He integrated high-frequency gridded climate data with building-level electricity and gas billing information from more than 30,000 individual units with gross square surface > 25,000 ft2 and accounted for a wide gradient of buildings’ density and uses, climate shift and electrification scenarios.
Nicolas provided a gridded dataset summing building-level predicted energy consumption impacts decomposed by sector (residents versus non-residents), space (boroughs and community districts), season (main cooling/heating vs. intermediate seasons) and Representative Concentration Pathway (RCP) simulations to the Mayor’s Office. His work contributes to more clearly identifying the unequal distribution of future energy demand impacts along social and economic lines, and in fine, the climate adaptation gap in urban areas.
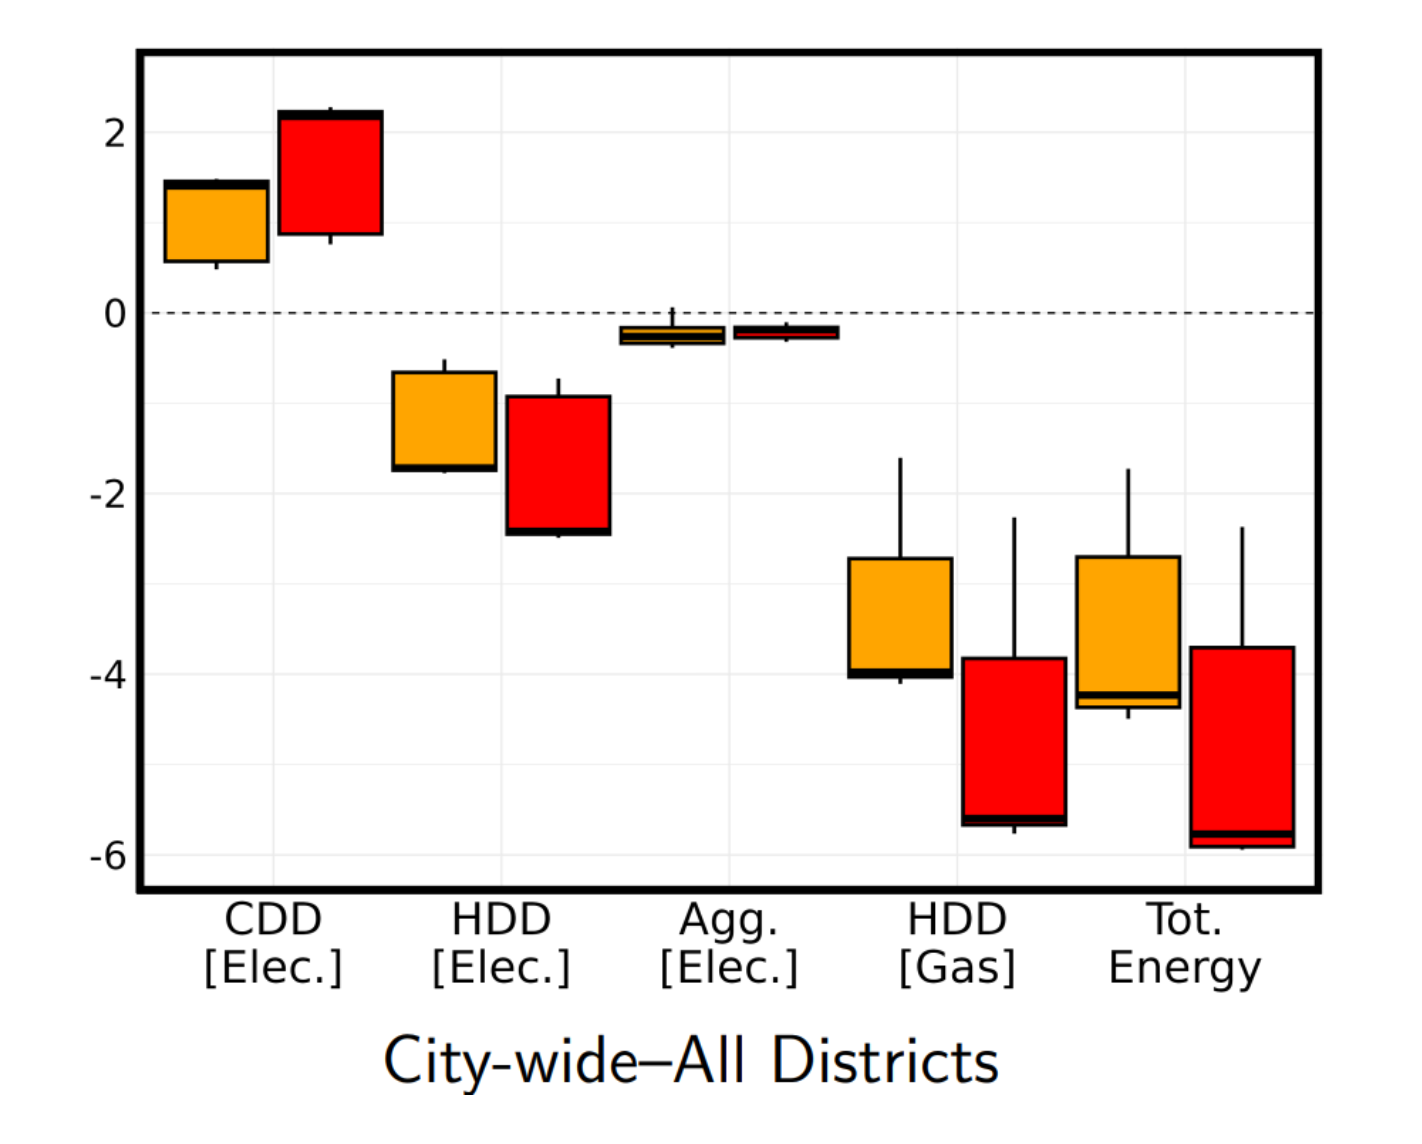
Notes: Mid-century climatically driven changes in temperature exposure are imputed from IM3-HyperFACETS meteorological fields downscaling CMIP6 model outputs in time (hours) and space (12km) across GCMs. For each RCP (8.5 here), GCMs are distributed between ‘Cooler’ and ‘Hotter’ subsets based on their Transient Climate Response (TCR) and Equilibrium Climate Sensitivity (ECS) likelihoods — inside ‘likely’ ranges (1.4-2.2◦C, 66% likelihood, and 2.5-4°C, 90% likelihood, respectively), versus outside (respectively). ‘CDD’: monthly sum of Cooling Degree Day counts (> 18°C). ‘HDD’: monthly sum of Heating Degree Day counts (< 18°C). ‘Agg.’: sum of impacts across climate components by fuel. ‘Tot.’: Energy: sum of impacts across both climate components and fuel.
Figure 1: Mid-century projected energy demand per ft2 impacts (%) by climate component and fuel, 2041-2060, multi-model medians of ‘vigorous’ warming scenarios [RCP85], ’cooler’ [orange, left-hand side box] versus ’hotter’ [red, right-hand side box] subsets of Global Climate Models (GCMs).