Cascading DoS Attacks on Wi-Fi Networks
posted by Liangxiao Xin (xlx@bu.edu)
Outline:
About cascading DoS attack
A cascading DoS attack exploits a coupling vulnerability due to hidden nodes. The attack propagates beyond the starting location, lasts for long periods of time, and forces the network to operate at its lowest bit rate. The attack can be started remotely and without violating the IEEE 802.11 standard, making it difficult to trace back.
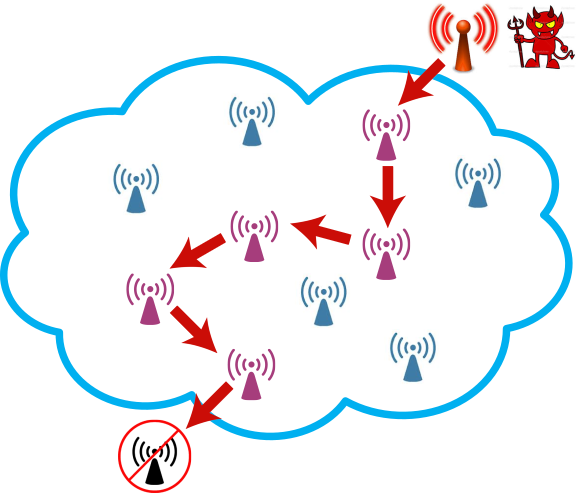
Figure 1 serves to illustrate this phenomenon at a high level. Suppose that an attacker increases the rate at which it generates packets, and transmits these packets in accordance with the IEEE 802.11 protocol. These transmissions may cause packet collisions at nodes concurrently receiving packets from other sources. Due to the infamous hidden node problem, which is hard to avoid in wireless networks, transmitters may be unable to hear transmission by other nodes, even when using CSMA, and hence keep retransmitting packets until they reach the so-called retry limit of the back-off procedure. These retransmissions affect other neighbours and may propagate.
Feasibility of the attack
Network model
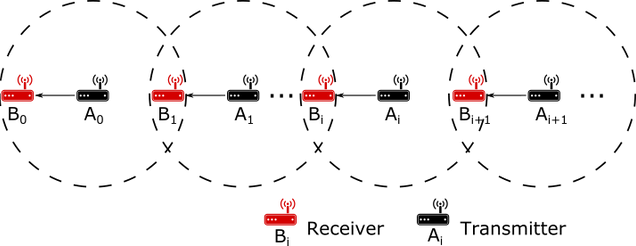
The network model considered in this paper is shown in Figure 2. We consider \(N\) pairs of nodes. Each node \(A_i\) (\(i = 0, 1, 2, \dots , N\)) transmits packets to node \(B_i\). The dashed circle represents the range of transmission. Node \(B_{i+1}\) can receive packets from both node \(A_i\) and node \(A_{i+1}\). However, node \(A_i\) and node \(A_{i+1}\) cannot hear each other. That is, node \(A_i\) is a hidden node with respect to node \(A_{i+1}\) (and viceversa). A packet collision happens at node \(B_{i+1}\) when packet transmissions by node \(A_i\) and \(A_{i+1}\) overlap.
Attack goal
Our goal is to investigate how node \(A_0\) can trigger a cascading DoS attack, resulting in a congestion collapse over the entire network. We start by increasing the packet generation rate at node \(A_0\). Node \(A_0\) transmits packets over its channel, in compliance with the IEEE 802.11 standard. The transmissions by node \(A_0\) cause packet collisions at node \(B_1\). These collisions require node \(A_1\) to retransmit packets. The increased amount of packet transmissions and retransmissions by node \(A_1\) impact node \(A_2\) and so forth. If this effect keeps propagating and amplifying, then the result is a network-wide denial of service, which we refer to as a cascading Denial of Service (DoS) attack. Because this attack is protocol-compliant, it is difficult to detect or trace back to the initiator. We note that the topology studied here could arise over different time and space in more complex network configurations.
Experimental result
We set up an experimental testbed composed of six nodes. The testbed configuration is shown in Figure 3. We establish an IEEE 802.11n ad hoc network consisting of three pairs of nodes. Each node consists of a PC and a TP-LINK TLMN722N Wireless USB Adapter. We use RF cables and splitters to link the nodes, isolate them from external traffic, and obtain reproducible results. We place 70 dB attenuators on links between node \(A_i\) and \(B_i\) (\(i \in 0, 1, 2\)), and 60 dB attenuators on links between nodes \(A_i\) and \(B_{i+1}\). The difference in the signal attenuation of different links insures that a packet loss occurs if a hidden node transmits. The transmission power of each node is set to 0 dBm. We use iPerf to generate UDP data streams and to measure the throughput achieved on each node. The length of a packet is the default IP packet size of 1500 bytes.
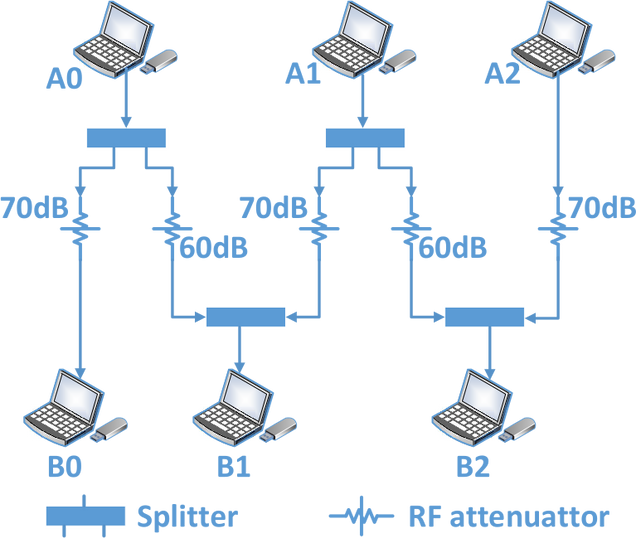
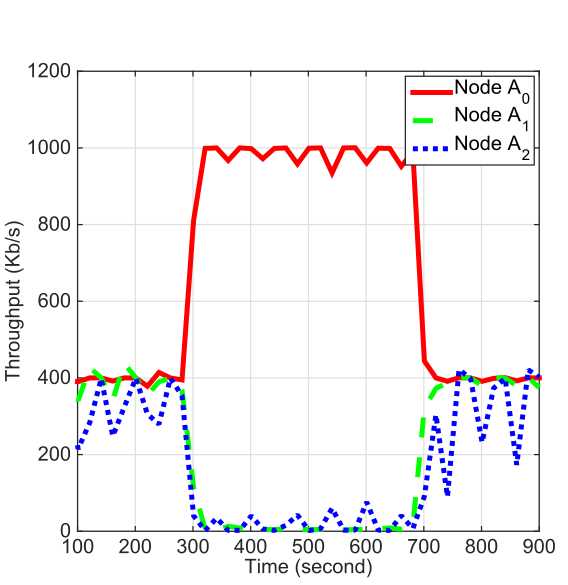
Figure 4 demonstrates the cascading DoS attack on the experimental testbed. At first, the packet generation rates of nodes \(A_0\), \(A_1\) and \(A_2\) are set to 400 Kb/s. We observe that the throughput of all the nodes remains in the vicinity of 400 Kb/s during the first 300 seconds. After 300 seconds, \(A_0\) starts transmitting packets at 1 Mb/s. As a result, the throughput of nodes \(A_1\) and \(A_2\) suddenly vanishes. Once node \(A_0\) resumes transmitting at 400 Kb/s, the throughput of node \(A_1\) and node \(A_2\) recovers.
Simulation result
In order to gain a better insight into the attack in large-scale networks, we resort to ns-3.22 simulations, a state-of-the-art simulator which includes high-fidelity wireless libraries. We show the occurrence of cascading DoS attacks in ad hoc networks with fixed bit rate.
We describe the occurrence of a cascading DoS attack in an ad hoc network with fixed bit rate. We consider a linear topology consisting of 40 pairs of nodes (i.e. a sequence of 40 hidden nodes), as shown in Figure 2. We fix the bit rate to 1 Mb/s and the retry limit to \(R = 7\). We set up a Wi-Fi network using the standard IEEE 802.11 library in ns-3. At each node \(A_i\), \(i \geq 1\), UDP packets arrive at rate \(\lambda_i = 8.125\) pkts/s. The packet generation rate at node \(A_0\), \(\lambda_0\), varies from 1.25 to 61.25 pkts/s. The size of each packet is 2000 bytes. Each node has the same transmission power (40 mW). We set the propagation loss between node \(A_i\) and \(B_i\) to 80 dB and the propagation loss between node \(A_i\) and \(B_{i+1}\) to 70 dB. We run each simulation five times for 1,000 seconds, and average out the results. The source code is available on Github.
The (exogenous) load at each node \(A_i\) is denoted \(\rho_i = \lambda_i T\), where \(T\) represents the duration of each packet transmission attempt (0.016 second in our case). The utilization of a node \(A_i\), denoted \(u_i\), is defined as the fraction of time the node is busy transmitting bits on the channel.
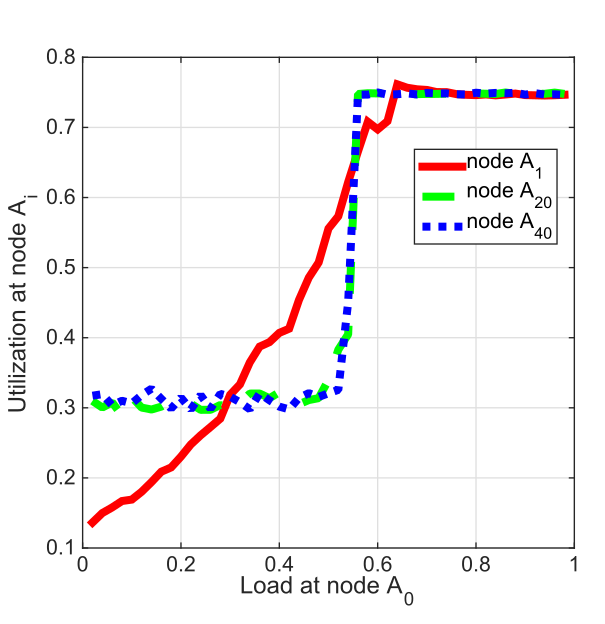
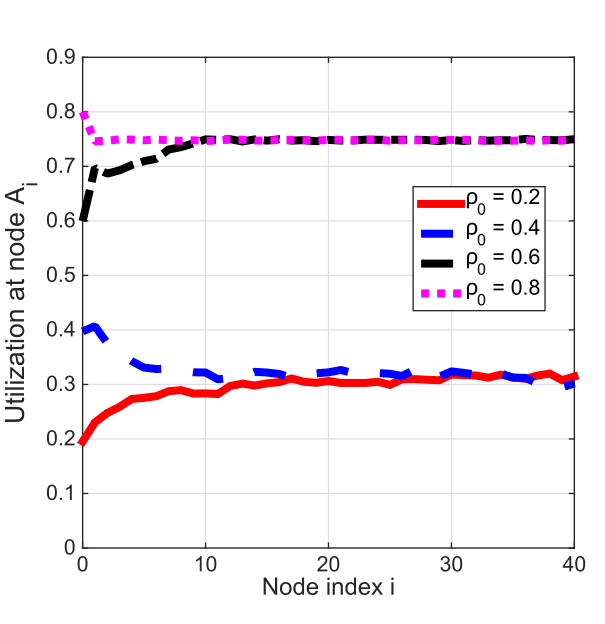
Figures 5 and 6 depict the utilization \(u_1\), \(u_{20}\), and \(u_{40}\) as a function of \(\rho_0\), the load at node \(A_0\). The utilization of node \(A_1\), \(u_1\), increases smoothly until it reaches its upper limit. However, the utilization of nodes \(A_{20}\) and \(A_{40}\) remains low until \(u_0\) reaches a certain threshold around \(\rho_0 = 0.5\), at which point \(u_{20}\) and \(u_{40}\) suddenly jump to a high value. This sudden jump corresponds to a phase transition, and the critical threshold represents the phase transition point.
|
|
|
Analysis
We develop an analytical model that provides insight into the network behaviour observed in the simulations and experiments. Specifically, our goal is to explain why and under what conditions the phase transition occurs, and shed light into the roles played by the retry limit R and the traffic load at the different nodes.
-
- Notations:
- \(u_i \): utilization of node \(A_i \)
- \(\rho \): (exogenous) load of node \(A_i \) (\(i > 0) \)
- \(R \): retry limit
- \(\overline{r}_i \): average retry count at node \(A_i \)
- \(\lambda \): exogenous packet arrival rate
- Assumptions:
- Notations:
Our model represents a special case of interacting queues, which are notoriously difficult to analyze. To make the analysis tractable, we assume that
-
-
- Packet transmissions and retransmissions at each uncongested node A_i form a Poisson process with rate \(\overline{r}_i \lambda \).
- The probability that a packet transmitted by node A_i collides is independent of previous attempts.
-
The above assumptions are similar to the “random-look” model used by Kleinrock and Tobagi in their analysis of (single hop) random access networks. We stress that beside these assumptions, the rest of our analysis is exact.
- Iterative analysis of the utilization:
Our goal is to find the utilization at each node \(i \geq 0 \) and in the limit as \(i \rightarrow \infty \). We consider the same scenario as in our simulations, whereby node \(A_0 \) (the attacker) varies its traffic load
\(\rho_0 = \lambda_0 T \)
while all other nodes \(A_i \) (\(i \geq 1 \)) have the same traffic load
\(\rho = \lambda_i T \)
where \(0 < \rho < 1 \). We aim to understand if and how changes in the value of \(\rho_0 \) affect the utilization of nodes that are located far away as a function of the parameters \(\rho \) and \(R \). We develop an iterative procedure to derive \(u_{i+1}\) from \(u_i\).
\(u_{i+1} = \min \left\lbrace f(u_{i}), 1 \right\rbrace\), (1)
where
\(f(u_{i}) \overset{\Delta}{=} \rho \sum_{r=1}^{R} \left( 1 – \mathrm{e}^{-u_{i}}(1-u_{i}) \right) ^{r-1}\).
- Limiting behavior of the utilization:
We next analyze the limiting behaviour of the iteration given by (1). The sequence \((u_i)_{i=0}^{\infty} \) corresponds to a discrete non-linear dynamical system. We say that \(\omega \in [0, 1]\) is a fixed point of (1) if
\(\omega = \min \left\lbrace f(\omega), 1 \right\rbrace \), (2)
The limit of the sequence \((u_i)_{i=0}^{\infty} \) is always one of fixed points in (2).
- Phase transition analysis:
A network is said to be congested if \((u_i)_{i=0}^{\infty} \) converges to 1. Else, the network is said to be uncongested. A network experiences a phase transition if there exists a fixed point \(\omega\), such that if \(u_0 < \omega\) the network is uncongested, and if \(u_0 > \omega\) the network is congested. We refer to \(\omega\) as the phase transition point.
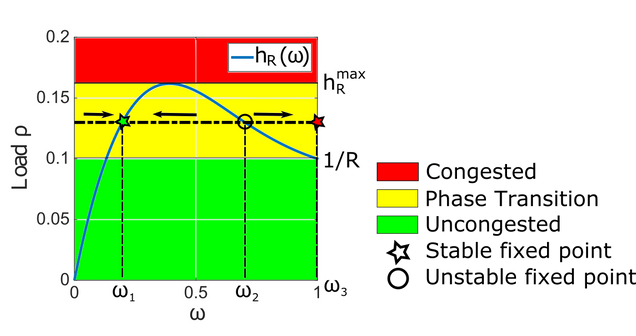
We introduce the function
\(h_R(\omega) \overset{\Delta}{=} \frac{\rho \omega}{f(\omega)} = \frac{\omega}{\sum_{r=1}^{R}\left(1 – \mathrm{e}^{-\omega}(1-\omega)\right)^{r-1}} \). (3)
For each value of \(\rho\), the fixed point \(\omega < 1 \) must satisfy
\( f(\omega) = \omega \).
We denote the maximum of \(h_R(\omega)\) by
\(h^{max}_R \overset{\Delta}{=} \max_{0 \leq \omega \leq 1}h_R(\omega) \)(4)
A network must fall in one of the following three regimes for different parameters.
Theorem
If \(\rho < 1/R\), then the network is uncongested for all \(u_0 \in [0, 1] \).
If \(h_R^{max}>1/R\) and \(1/R<\rho<h_R^{max} \), then a phase transition occurs.
If \(\rho>h_R^{max} \), then the network is congested for all \(u_0 \in [0, 1] \).
- Example
We illustrate the theorem above at \(R=10\). As shown in Figure , we observe a phase transition region, whose size is \((1/R, h_R^{max})=(0.1, 0.162)\).
Conclusion
- First experimental demonstration of remote and protocol-compliant DoS attack on Wi-Fi networks, which is backed by simulation and analysis.
- A small change in the traffic rate of the attacker can lead to a phase transition of the entire network, from uncongested state to congested state.
- Retry limit parameter of Wi-Fi plays critical role in the phase transition.
Reference
Liangxiao Xin, David Starobinski, and Guevara Noubir, “Cascading DoS Attacks on Wi-Fi Networks,” IEEE CNS 2016, Philadelphia, PA, October 2016. pdf code (Best paper award)