Food Mapping: Revealing the Unseen
Written by Sarit Sadras Rubenstein for Anthropology of Food
“Food mapping is an image-based approach to research that pays attention to the way people relate to food in the interaction of senses, emotions, and environments” (Marte 2007).
Food mapping is an interesting assignment students take during “Anthropology of Food” class. Food Mapping is a tool, that even though it is relatively simple to apply, reveals many interesting things, much of which would not be revealed otherwise.
For my mapping assignment place I chose a local Target store, one that I know pretty well. That specific store has a Target-cafe corner with two vendors: Starbucks and Pizza Hut. Every time I bought coffee at Starbucks I always wondered if and when people buy at the Pizza Hut place. It always seemed empty… That is why when we had the chance to observe a place and map it, I chose to observe this specific cafe corner. In my observation I was hoping to learn more about how people interact at this specific cafe corner, in relation to the two vendors, the environment and to other people in general.
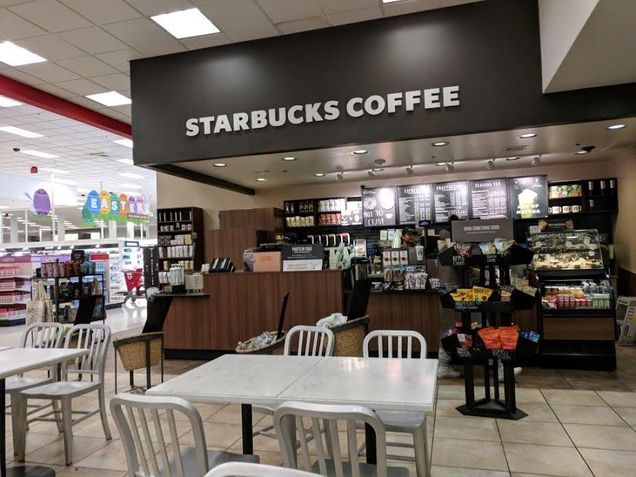
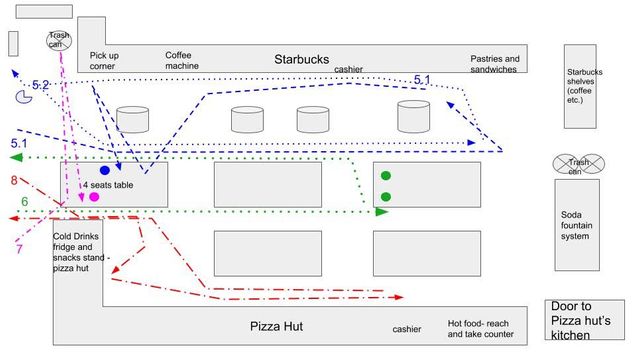
It is good to start with a description of the area being mapped. Examples of such description can include where each vendor is located, how many sitting tables are there, what colors are being used as decorations, and anything that can help the researcher get familiar with the space. In my specific observation the cafe shop is located at the edge of the store, as with most of Target’s cafes, where one can walk in and go straight to the cafe without walking through the aisles. Facing the cafe space, Starbucks is placed on the left side and Pizza Hut on the right (see a map and pictures attached). Overall I would argue the environment is not as inviting as it could have been. The tables and chairs are made of metal, giving a ’cold’ and unpleasant look and feeling. It seems as it matches the decor of the Pizza Hut spot more than it fits the Starbucks one.
For the process of the observing, I arrived at the cafe around 10:45 am. I chose the table that is furthest away from the entry, which gave me a great view of the whole cafe space. I started to map the cafe area, making three copies so I would have extra copies in case I needed it. By the time I finished, it was almost 11:15, the tables were available and no people at either the coffee or the pizza lines. That didn’t last too long though, since at that very minute new customers started to show up, so I started my observation. All the people interactions I observed that morning were detailed by the order they arrived to the cafe, and were drawn on the maps I have created, as you can see at the example attached.
Once the observation is done, the interesting part starts: analyzing the data and see what can we learn from that exercise. Some conclusions from my observation were quite surprising. For example, the vast majority of the customers were women, unaccompanied. During my observation I noticed only three men, out of which only one actually bought a drink at Starbucks. All the other customers were women. This is a very interesting observation. It is worth investing more time and other observations during other days and times of the day. If this is a repeating phenomenon it can be used as a great marketing tool to the cafe and Starbucks.
Another interesting conclusion I noticed was regarding the shopping carts. I can definitely argue that there is a shopping cart parking problem while buying at the cafe. There is no organized and defined place to park shopping carts while waiting. This situation results in people blocking the line (mostly the line for Starbucks) or placing their carts in other people’s way. I think it is worth investing more time and think of a creative idea to reorganize the space in order to improve this issue. These are just two single examples out of few conclusions this observation taught me
about that specific environment and the people who attend it.

One of my findings was regarding the number of tables and sitting spots at the cafe. It seems as if the number of tables is suitable for the amount of customers who choose to sit down at the cafe. That said, this note needs to be observed again, especially during times when families shop with there kids and might need more space to sit down and have a short snack break. In such times there may be shortage in tables or chairs. Also, there is a point to argue what would be the outcome if the cafe looked a little more inviting? Would this lead to people hanging out more? In a such a scenario, would the number of tables and chair suffice the location or would it need to be adjusted?
Obviously some of the questions that arise from this exercise are very interesting but still theoretical. To answer such questions, more research and observations needs to be done. Such research will probably take us outside of the academic world, since it will have to take into account the goals and objectives the organization, Target in this case, defines for itself.
As Marte (2007) claims, food maps are useful not only for food studies, but also for other kinds of research. I can surely see how food maps can come handy for such organizations as a marketing tool and a strategic tool. I wonder if and to what extent big organizations, such as Target, use such tools, as food mapping, to learn and streamline their customers’ experience.
References:
Marte, Lidia. 2007. Foodmaps: Tracing Boundaries of “Home” Through Food Relations. Food & Foodways 15(3-4): 261-289.