The first graph I choose is about the hashtag #ISQua2018. It is a conference held by The International Society for Quality in Health Care every year in a city worldwide so it attracts health communities to talk about it. The graph represents a network of 917 Twitter users who mentioned the hashtag #ISQua2018 and were taken from the tweets tweeted from 17 September 2018 to 27 September 2018.
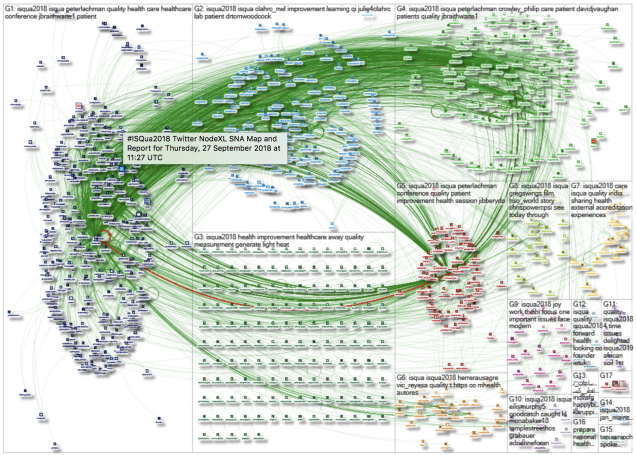
(Address: https://nodexlgraphgallery.org/Pages/Graph.aspx?graphID=169360)
The graph matches Tight Crowd according to Smith and his colleagues found having 3 medium groups and several small groups with a few isolated participants. Each group is connected with each other as a unity. Therefore, I classify it as the network type of Tight Crowd according to Smith’s classification methods. However, while it matches most of the description of Tight Crowd communities, it also contains some isolates which have no connections with others. This group of isolates appears in the group including topics of light and heat, which I think is kind of deviated from the theme of health care.
For the influential participants of the #ISQua2018 hashtag, it is mainly used by the official Twitter account of ISQua and people who manage this organization, like its CEO Peter Lachman, director David Vaughan and other health-related organizations like IHI (The Institute for Healthcare Improvement). They tend to share the basic information of this organization’s annual conference which takes place in Kuala Lumper this year. The situation reminds me of a concept which Rainie and Wellman said in their book Networked: The New Social Operating System — networked self. The two scholars defined the networked self as a single self that gets reconfigured as people reach out, connect and emphasize different aspects of themselves in different situations (Rainie & Wellman, p126). I found that these managers of the conference shaped a new self on the Twitter, a professional self, and connect with other professionals in the same area to share each other with timely information. This self may totally different what they are on Instagram. And that is also why the graph is like a Tight Crowd, because people in the same area seems to be connected together and formed a medium-size community.
As for the examination of hashtags, it does have some kind of cross connection among different groups. Besides mentioning isqua2018, some groups mentioned the hashtag quality Malaysia and Kuala Lumpur together, suggesting that they care about mentioning the place where the conference takes place.
The second graph I choose is Cadillac, the famous vehicle brand. The graph represents a network of 1133 Twitter users who mentioned the hashtag #Cadillac and were taken from the tweets tweeted from 23 September 2018 to 6 October 2018.
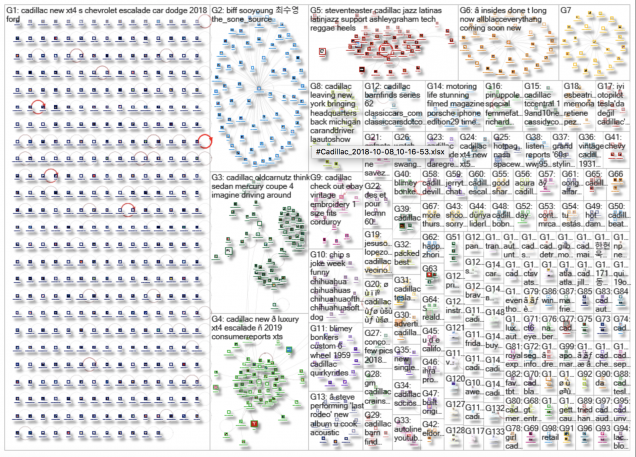
(Address: https://nodexlgraphgallery.org/Pages/Graph.aspx?graphID=170780)
The graph matches the type of structure of Brand Clusters. It has many isolates and small groups, each small group having few connections with others. People who talked about it vary from place to place and the network map features a large population with no connection with each other. However, there do exist some groups which contain a hub, visible in the center and upper right space of the graph, different from the example of Apple displayed in Smith’s essay. Like the Apple example, I found that none of the URLs mentioned in the larger groups were mentioned in other groups, separating with each other, which means that these groups are distinct and talked about different topics about the brand.
For the top influencers of the #Cadillac hashtag, the official account @cadillac ranks the first one with 640k followers. And the top mentioned user of the whole graph is unexpectedly from a fans account of a Korean superstar because the superstar arrived some place in a Cadillac. This account has many connections with other fans accounts so it stays in the center of this group and spread outward to other users. For the hashtags, each groups of hashtags seldom overlap, suggesting that different groups of people’s topics on Cadillac on the Twitter vary from each other.
Smyrnaios states in his book Internet Oligopoly that in the era of Web 2.0, online advertising is no longer dependent on targeting at masses of undifferentiated Internet users with the same marketing message (Smyrnaios, 2018, p118). The online advertising must be based on people’s online behaviors, surfing contexts and socio-demographic. This is in line with what Smith put as Brands Clusters structure on social media. As when people discuss brands on social media, the social network map is likely to have very low density and many isolate participants joining together to talk about the brand. They tend to mention the brand without having any connection to other people who has mention the brand, which suggests that users of products are separate and independent identity. Therefore, in the Advertising 2.0, corresponding to Web 2.0, a brand manager must think more about how to target social media audience with promotional message and attract their attention in a saturated information environment (Smyrnaios, 2018, p118).
Works Cited:
Rainie, L., & Wellman, B. (2014). Networked: The new social operating system. Cambridge, MA: MIT Press.
SMYRNAIOS, N. (2018). INTERNET OLIGOPOLY: The corporate takeover of our digital world. BINGLEY: EMERALD GROUP PUBL.