NEPHTC: Making Happy Users
Happy training users makes NEPHTC is happy to share results!
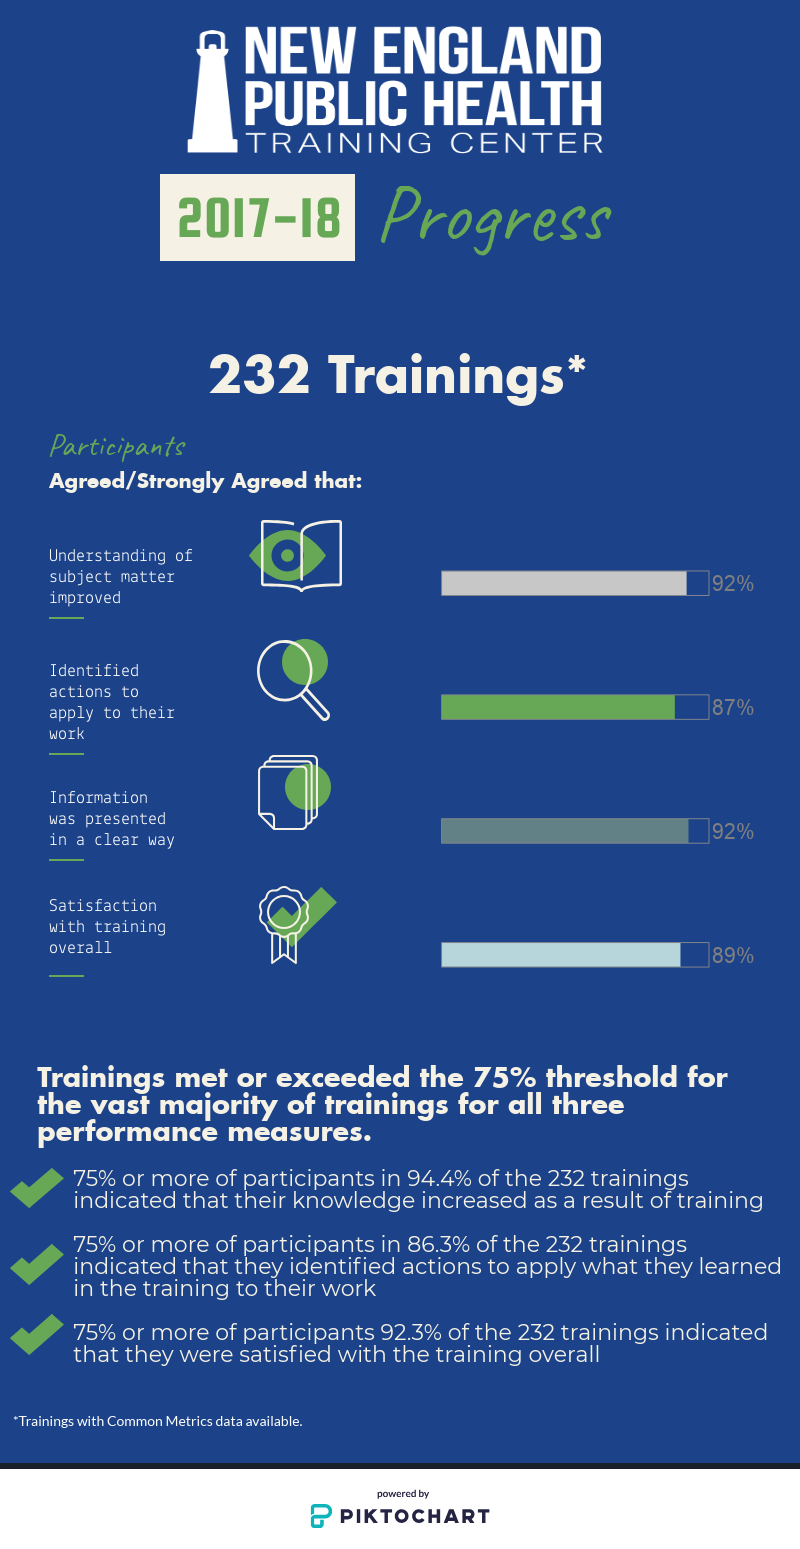
Our last year of training common metrics data, displayed in the infographic, shows that NEPHTC continues to be strong on the four nationally collected data questions (“the common metrics.”) Measured in two different ways, users continue to report overall satisfaction, that their understanding of subjects improved, and that information was presented clearly.
For 86% of trainings, 75% or more participants said they had identified actions they can apply to their work. This metric has regularly been a little lower than the others for NEPHTC. When we have probed why, in individual courses, users respond that the learning often could not be applied in their work in the near future. For example, a user may be learning about budgeting, but may not be in a budget-influencing role.
Strong training results do not come easily, and NEPHTC encounter difficulties like other small training organizations. NEPHTC continues to work behind the scenes on quality improvement. Like other organizations, we face many technology, or user interface issues that cannot be quickly resolved, such as user navigability of our learning management system. As we work on those issues, we will to strive to improve these numbers each year.