Methods
Classification Legend
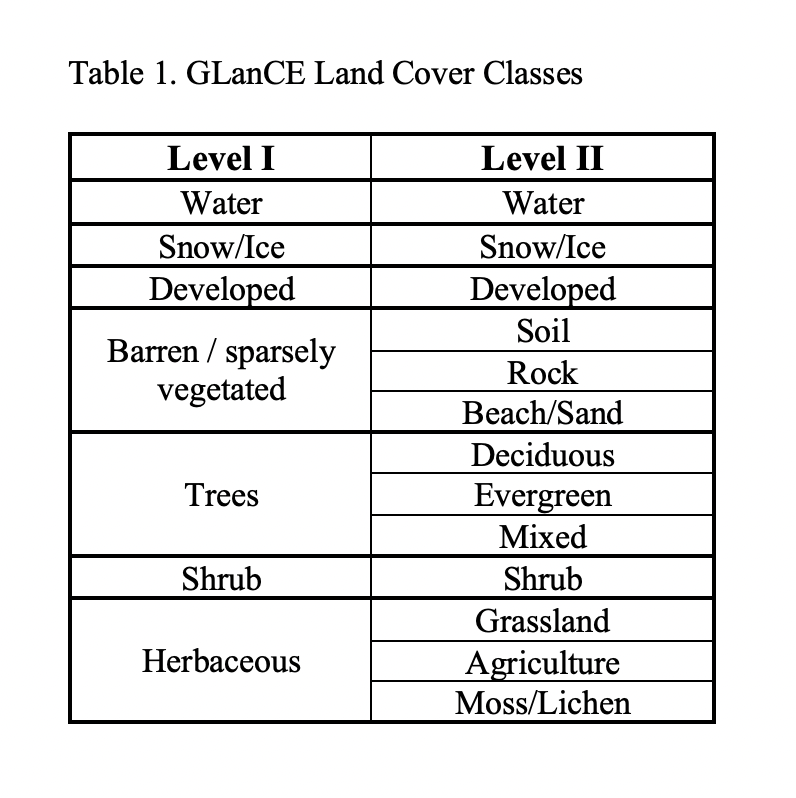
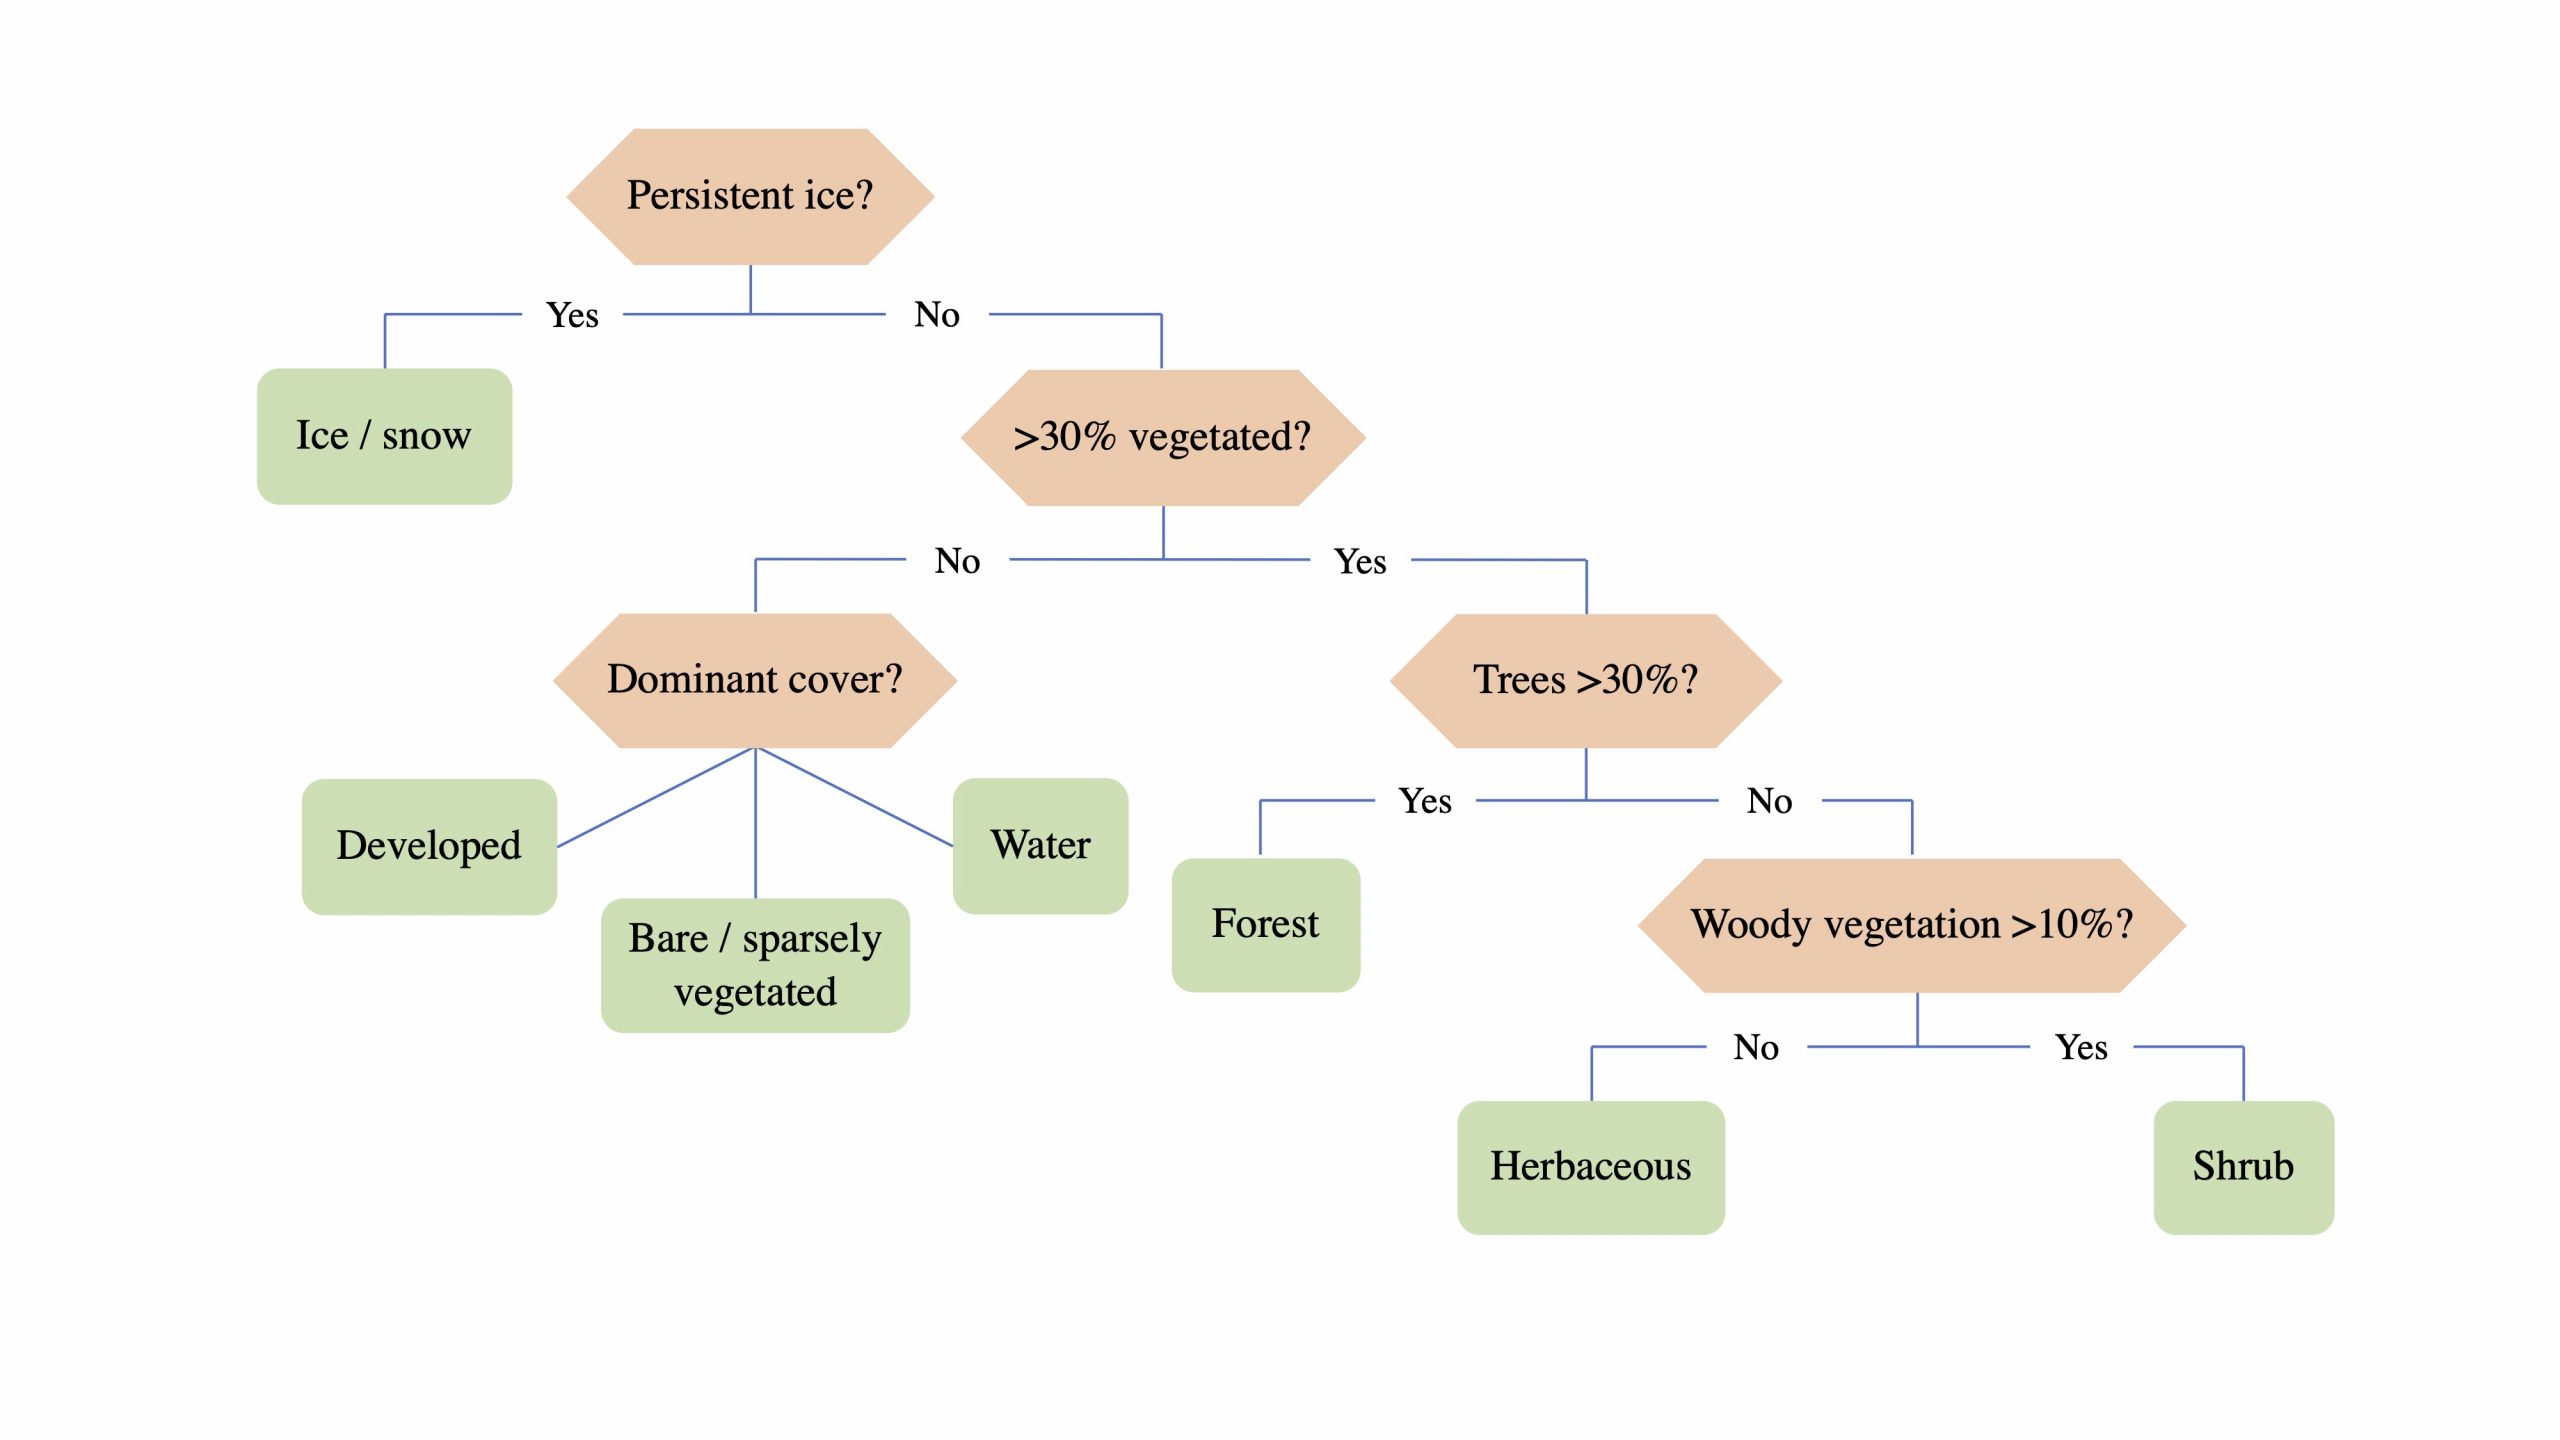
The GLanCE land cover classification scheme contains two levels. Level I contains the initial land covers that are being mapped, while level II expands on the land covers from level I and will be mapped in the future. Additional attributes have also been collected by research assistants throughout the data collection and will be included in the training dataset.
Training Data
The GLanCE training database was created by collecting and curating four different kinds of data: 1) on-screen interpretations by in-house image analysts, 2) publicly available regional-to-global datasets, 3) national-to-regional collaborator-provided samples, and 4) samples collected by team members for a variety of projects. In-house data were collected using our classification legend (shown above) and tools developed for the project to label high resolution imagery. Then the land cover legends of supplementary datasets were harmonized to our own land cover labels and we compiled datasets into a single database per continent. In some regions, we rebalanced the class distribution by adding MODIS-derived training samples generated based on an approach developed by Zhang & Roy (2017). Lastly, we removed poorly labeled samples based on a machine learning cross validation procedure, which was adapted from Brodley & Friedl (1999).
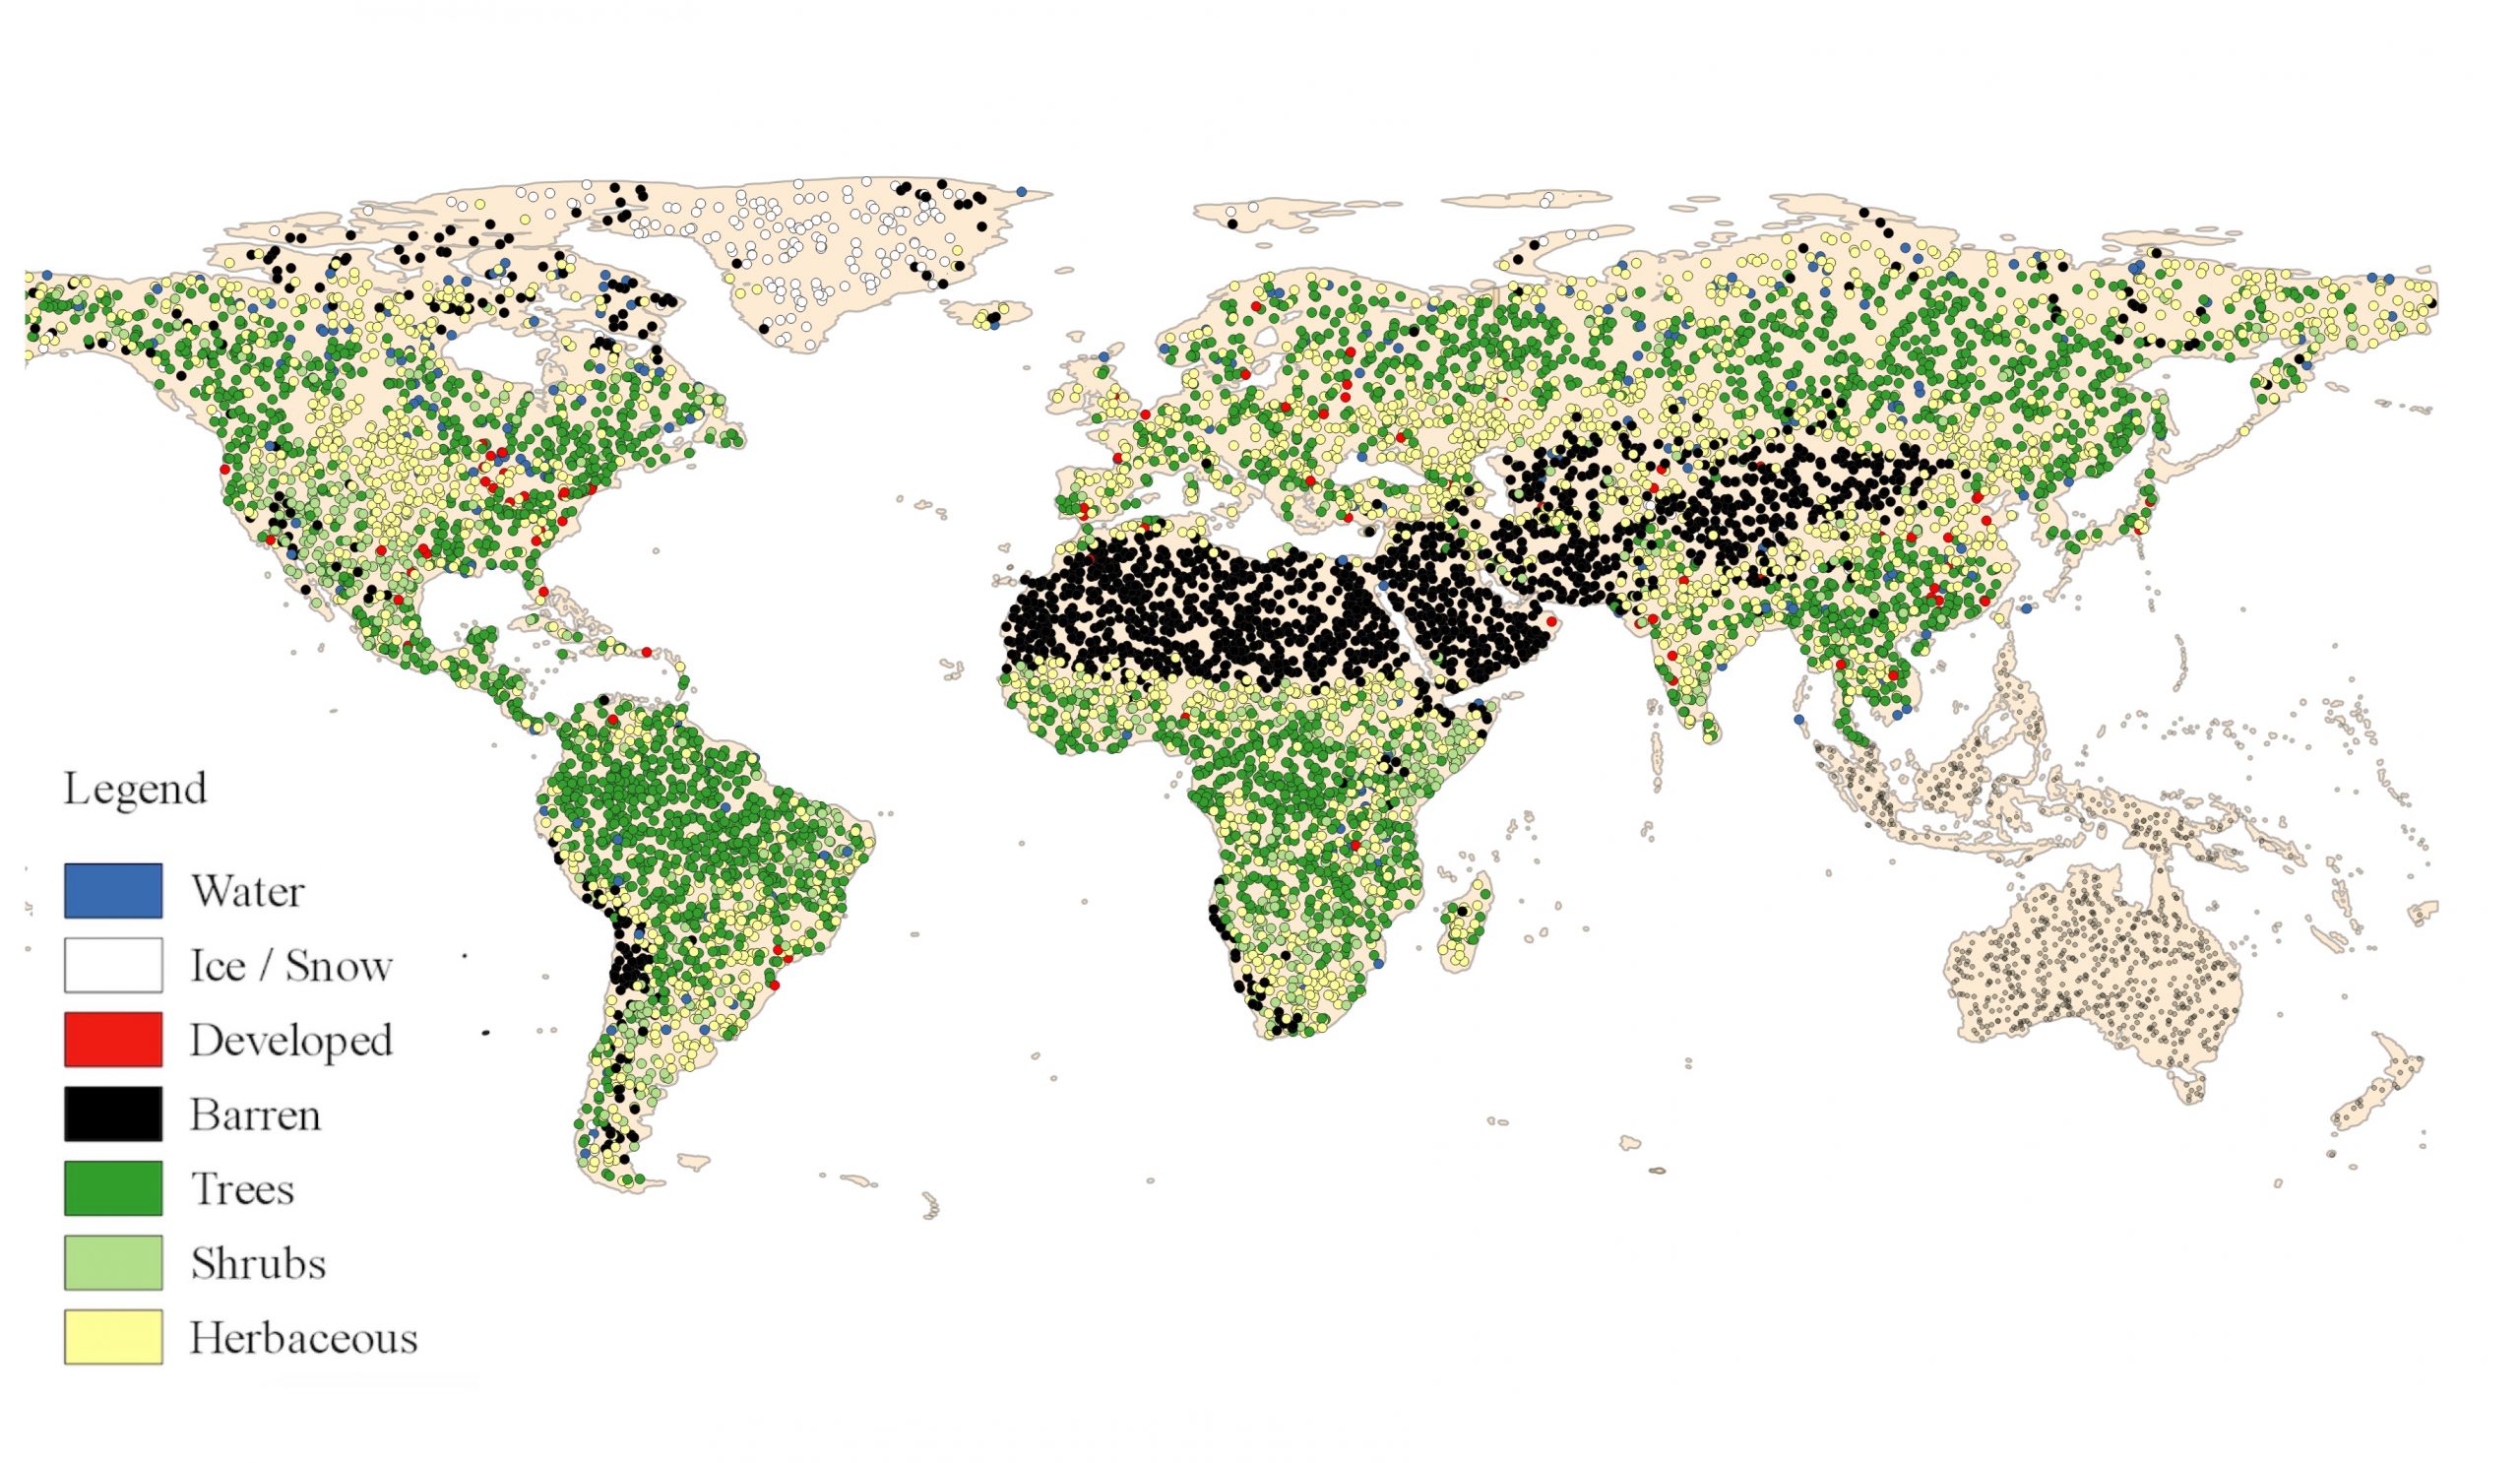
Training data was collected on a continent-by-continent basis. Below is the full training data set.

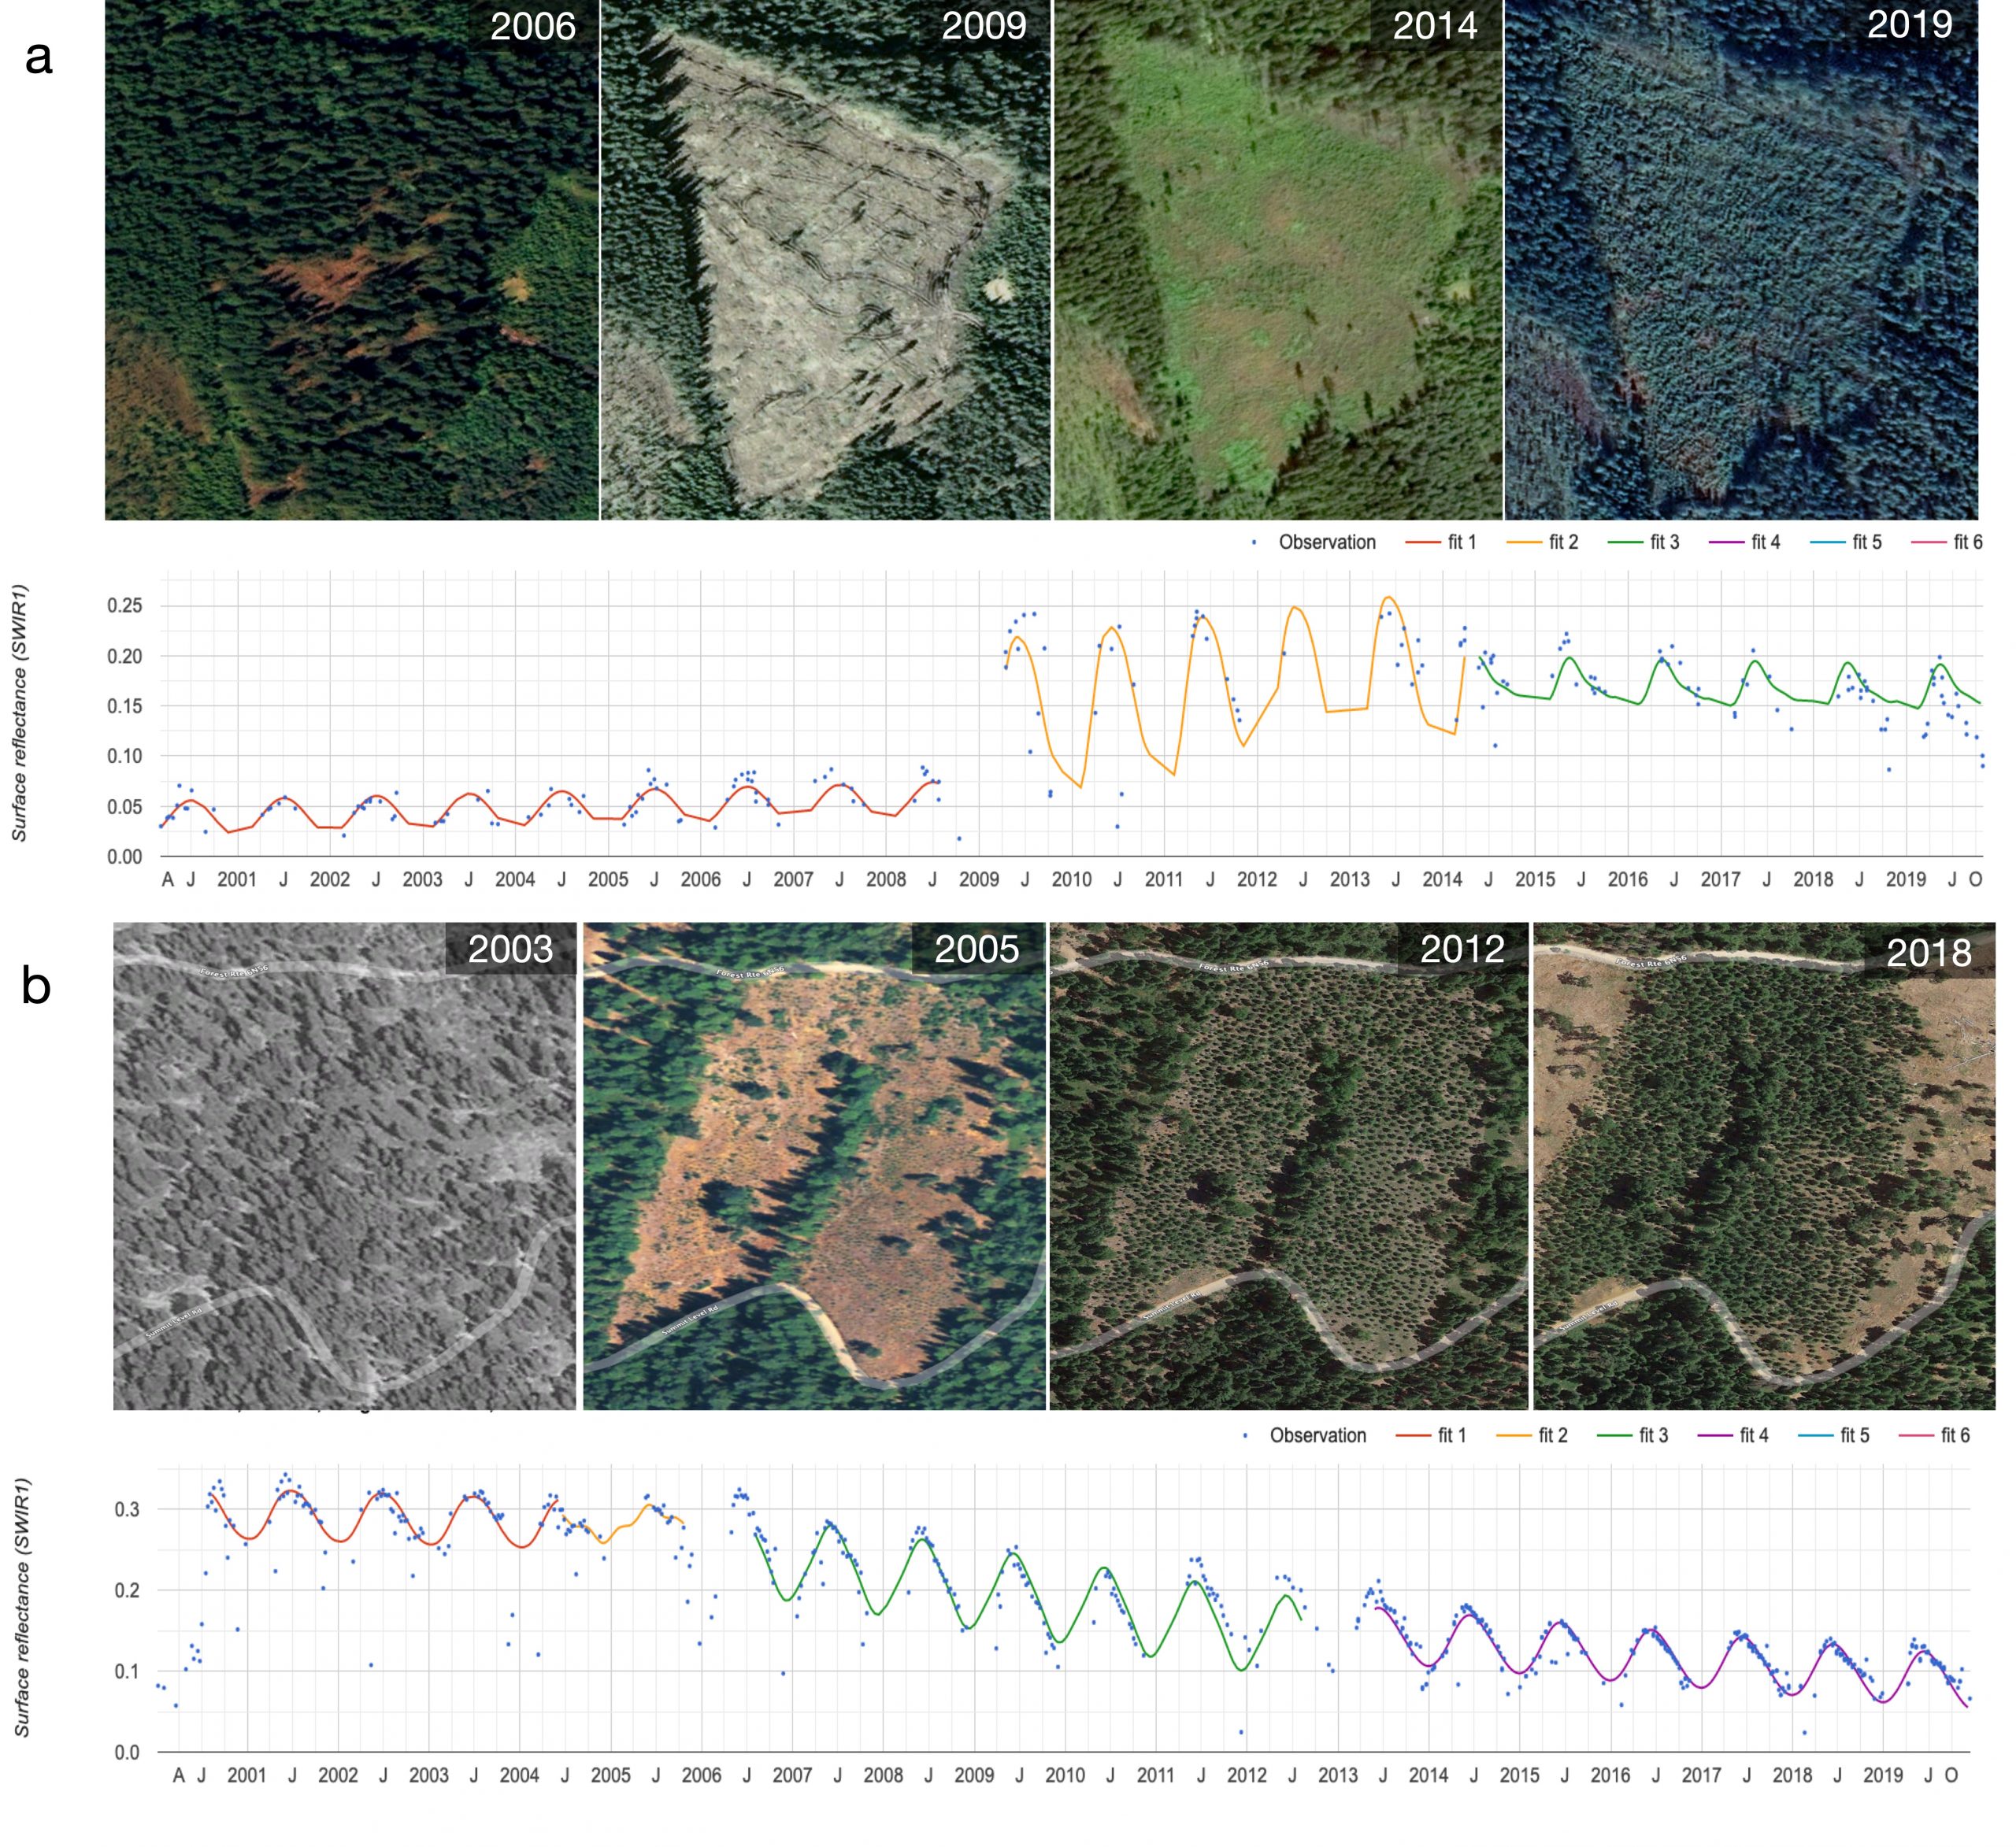
Continuous Change Detection and Classification
The core algorithm that is being used to perform the mapping is the Continuous Change Detection and Classification (CCDC) algorithm, developed by Zhe Zhu and Curtis Woodcock. Land cover is assigned through two core steps:
- Identification of change points and modeling of stable time segments.
- Assignment of class labels to time segments.
Accuracy Assessment and Reference Data
To get accurate estimates of land cover area we are collecting reference data which will be used to get:
- the overall accuracy of the land cover and land change maps
- and the global user’s and producer’s accuracy of each map category, along with estimates of associated 95% confidence intervals
For more in-depth details on the steps that were taken to produce the maps, please reference this paper in Frontiers that outlines the steps in greater detail and presents initial results.