1.0: Introduction
The following assignment will evaluate social networks, and will specifically look at the hashtag Immigration via the platform Twitter.
We can assess the visualized network through three key elements: (1) color nodes that identify certain communities within a given topic, (2) size nodes that tell the prominence of said conversations, (3) how the graph is spatialized within the formulated network structure.
There are many factors that play into the six visual social networks: (1) polarized crowd, two big and dense groups that have little connection between them (2) tight crowd, highly interconnected people (3) brand clusters, disconnect participants (4) community clusters, few hubs each with its own audience, influencers, and sources of information (5) broadcast network, many people repeat what prominent news and media organizations tweet (6) support network, hub and spoke structure (Smith et.al, 2014).
By analyzing it through the lens of Smith (et.al, 2014), two case studies on Immigration and Climate Change, and Smyrnaios’ (2018) concept of vertical integration and informediation this paper will further support that yes, infomediation and vertical integration does indeed shapes network types.
2.0: #Immigration Social Network

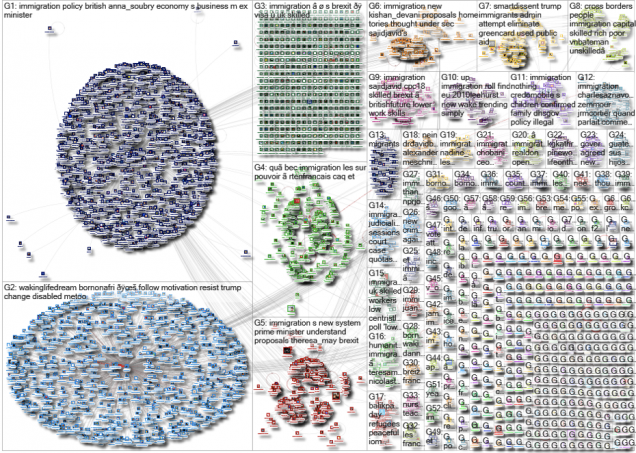
Figure 1: #Immigration (NodeXLExcelAutomator, 2018, https://nodexlgraphgallery.org/Pages/Graph.aspx?graphID=170850)
Figure 1 is the graph consisting of a network of 6,033 Twitter users whose tweets in the requested range contained “#Immigration”, or who were replied to or mentioned in those tweets (NodeXLExcelAutomator, 2018). The network was obtained from the NodeXL Graph Server (2018) on Tuesday, 09 October 2018 at 13:39 UTC over a course of 14 days. The maximum number of tweets collected was 5,000.
The graph is directed. Fig. 1 consists of two big and two smaller polarized crowds with very little connections between them. These polarized crowds, however, brand off into community clusters, that inspire more community clusters with conversations with different takes and inputs of the original topic. In addition, it is important to note that different cultural and geographical setting can affect the network and the scope of conversation, G1 and G2 (Fig.1) are perfect examples of this.
3.0: Climate Change Social Networks

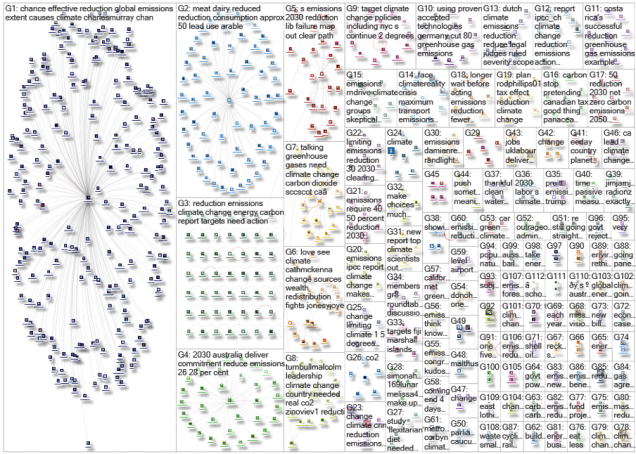
Figure 2: # ClimateChange (NodeXL, Excel Automator, https://nodexlgraphgallery.org/Pages/InteractiveGraph.aspx?graphID=171346)
The graph represents a network of 843 Twitter users whose tweets in the requested range contained “(Climate change) OR ((renewable OR alternative OR conservation OR clean OR future energy) OR (emissions reduction)”, or who were replied to or mentioned in those tweets. The network was obtained from the NodeXL Graph Server on Sunday, 14 October 2018 at 09:11 UTC. The maximum number of tweets collected was 5,000. The graph is directed.
The climate change issue however, although all related to the same field, is broken up into many subtopics that are visualized into individual brand clusters. Within each cluster are smaller, basic community clusters. Like the #Immigration visual network, it is important to note that the context will also dictate the amount of interactivity between users and the topic.
4.0: Analysis
Smyrnaios (2018) defines infomediation as the “set of socio-technical mechanisms that provide internet users with all types of information online and connect them with other users”. Such mechanisms are like software, services and infrastructures are factors that information is disseminated through; whereby boundaries between products and consumers are being blurred.
This idea of infomediation is implicated in an oligopoly in that a few big firms that control a field are using these streams of information. This would then influence people’s opinions and information that being said about different fields while dominating conversation. Whereas vertical integration, is “defined as bringing together a complementary set of business activities that constitute a production chain under the same decision-making power” (Smynaios, 2018). This can be implicated through visual social networks, in particular, the twitter hashtag, and or conversation topic, therefore becomes a vital characteristic of how people interact with certain conversations thus creating different visualized networks (Smith et.al, 2014).
Therefore, yes, it goes without saying, infomediation and vertical integration do shape network types.
5.0: References
Smith, Marc. Rainie, Lee. Shneiderman, Ben. Himelboim, Itai. (2014) “Mapping Twitter Topic Networks: From Polarized Crowds to Community Cluster” Pew Research Center: Internet & Technology. Retrieved http://www.pewinternet.org/2014/02/20/mapping-twitter-topic-networks-from-polarized-crowds-to-community-clusters/
Smyrnaios, Nikos. Internet Oligopoly: The Corporate Takeover of Our Digital World (Digital Activism and Society: Politics, Economy and Culture in Network Communication) (Kindle Locations 1561-1565). Emerald Publishing Limited. Kindle Edition.
Rainie, Lee. Networked: The New Social Operating System (MIT Press) (Kindle Locations 5735-5741). The MIT Press. Kindle Edition.