News
2021 Q1 Update: A new web application & sign-up for 2021 now active
Dear TASpeR Science Community,
I am writing to provide some important and exciting updates about the TASpeR project! We’ve updated our website with new features, have some preliminary findings to share, and set ambitious goals for our 2021 sampling. We have some exciting plans to share in the upcoming months and I thank you so much for participating in this community scientist project--it truly would not be possible without your support!
Here’s a more detailed update:
Website
In addition to email updates, we will now be posting project updates as blog posts on our website. The blog format provides a convenient way for members of our community to see summaries of past project updates. We will also be sharing content related to community science, red maple, species variation, and tree resource use regularly on our newsfeed and twitter account (@tasper_project).
Map of preliminary findings
I am extremely excited to announce that our website update also includes an interactive map of the preliminary findings from the TASpeR project so far. The map currently provides the opportunity for you to look at green and fallen leaf %N, along with estimates of nutrient resorption (the process by which nutrients are conserved by plants during senescence). I encourage you to have a look at the interactive map I made, which can be viewed on our website: https://sites.bu.edu/tasper. I aim to update this map regularly with new features and data on a regular basis.
Setting goals for 2021 sampling
2021 is the third year for the TASpeR project and we’ve set the ambitious goal of 250 participants, which is more than double the number of participants from the last two years combined. From 2019-2020, we had about 115 total participants which so far has resulted in a good number of samples and an exciting data set. We hope to expand participation in the project up to at least 250 participants this year to make sure our findings from the first two years are robust. Additionally, 2021 is likely the last year we will focus on red maple leaf nutrient content. In future years our focus is likely to shift in focus and scope, but will still emphasize how individual species vary through their geographic distribution. Will you help us reach our goal of 250 participants in 2021? If so, please let us know via this form and we will reach out with sampling protocols and further details: click here for sign-up form
Take care & thanks for all you do,
Steve Gougherty
Update and Continuing TASpeR into 2020
Although our laboratory at Boston University was shut down for about 3 months this spring due to Covid-19, we have now returned to research activities. In the next several weeks we will have data on the fallen leaf samples, and will be working in the lab to obtain phosphorus concentrations of the leaves that were submitted in 2019. We are very excited for these next steps, and also want to share some preliminary findings from the green leaf samples submitted in 2019. We hope that you can join us again in 2020 and thank you in advance for supporting this scientific research!!!
For 2020, we are focusing again on red maple. In addition, for those who plan to sample in forested or non-managed areas we are also interested in the plants growing next to red maple in order to understand how red maple may change relative to the rest of the community of plants along its geographic range. We have provided an updated sampling protocol and datasheet for 2020. If you are interested in joining us again this year please let us know by completing this form so we know how many participants we will have this year: here is the link to the form
Green leaf samples - Preliminary results
Mean annual temperature
We found that the %N in the red maple leaves (mass of nitrogen in leaves / mass of leaf *100) was significantly related to the mean annual temperature of the collection locations (p<0.01). On average, for every degree Celsius increase in mean annual temperature, the %N in the leaves decreased by about 0.02%. Although the relationship between mean annual temperature and %N was significant, this relationship was not particularly strong. In fact, mean annual temperature explained only about 8% of the variation in leaf %N, suggesting other factors could help to account for the remainder of the variation. We are currently working on developing models to include additional information from the data sheets that participants filled out and submitted with their leaves.
Mean annual precipitation
We did not find any significant correlation between mean annual precipitation and %N in the red maple leaves collected in 2019 (Figure 2). However, in future analyses of this data we will leverage gridded weather data from 2019 (e.g., https://daymet.ornl.gov/) to understand how the actual observed weather conditions may affect %N in red maple leaves. We anticipate that the actual observed weather conditions will be important, particularly because several participants noted in their datasheets that 2019 was an abnormally droughty year.
We appreciate the participants’ contribution to this research and and we look forward to continuing this project into 2020.
Maple identification blog post
Don Drife put together a great blog post over on his website about identifying different maple species found in Michigan. Check it out here: http://www.michigannatureguy.com/blog/2019/08/14/michigan-maples/ Don is also participating in the TASpeR project!
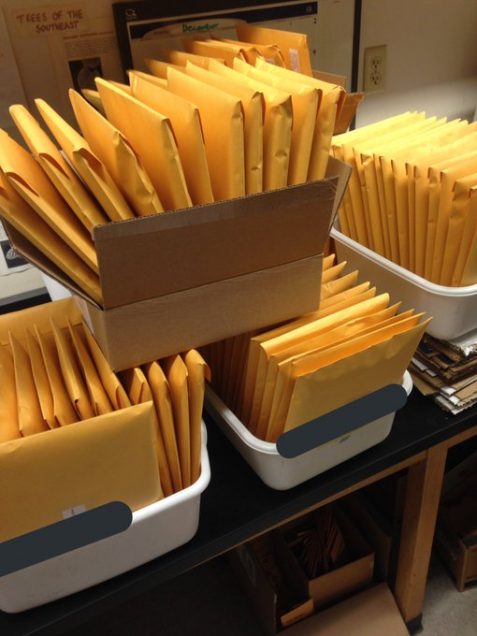
Sampling Kits Sent Out!
The TASpeR project is underway! We have sent out over 120 sampling kits to Citizen Scientist participants throughout the eastern United States. We are excited to start to get some leaf samples rolling into the lab.