Temporal Variations
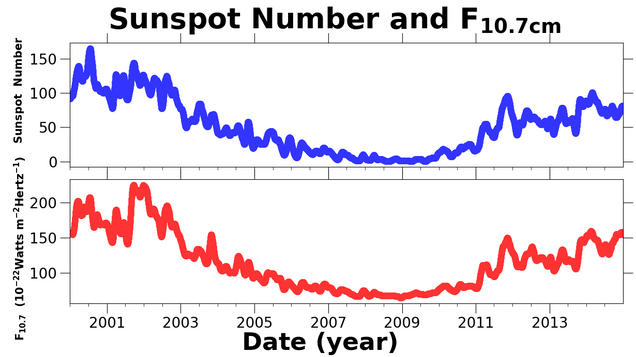
The atmospheric airglow varies on time scales greater than 200 seconds, and on spatial scales greater than a few degrees. The Sloan Digital Sky Survey (SDSS) and Baryon-Acoustic Oscillation Spectroscopic Survey (BOSS) have observed sky spectra for over 15 years, and the OH emission intensity is significantly correlated to solar activity. The plot of sunspot number and F10.7cm are given below for comparison.

The variations in OH intensity are the greatest on annual and over night time scales. The annual variations in OH intensity are due to global scale circulations.
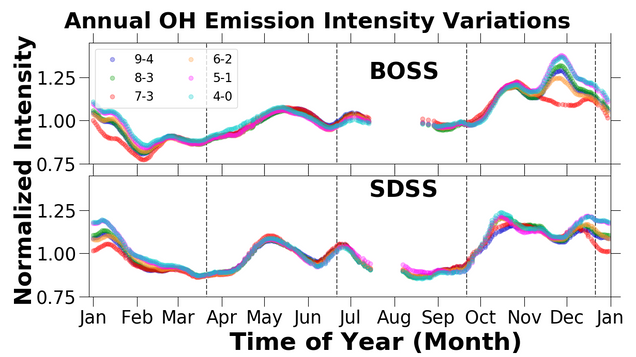
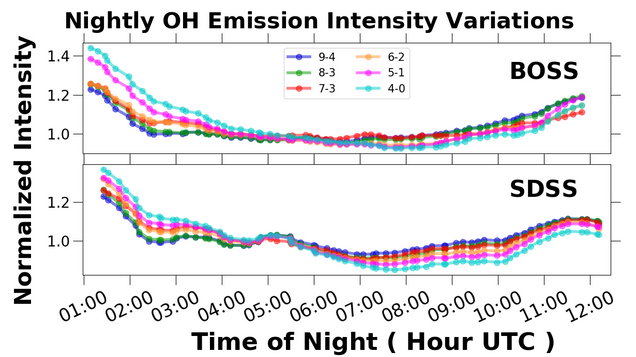
While the nightly variations are due to changes in emission layer thickness before local midnight, and an increase in chemistry after midnight.
To further investigate the variations in OH emission intensity observed by ground based instruments satellite data was employed. The Sounding for Atmospheric Broadband Emission Radiometer (SABER) on board the Thermosphere Ionosphere Mesosphere Energetics and Dynamics (TIMED) satellite has conveniently been in operation since 2001. SABER samples volume emission rates in 17 channels to generate atmospheric profiles of temperature, concentrations, and emission intensity. The OH molecule is produced through the ozone hydration reaction, H + O3 –> OH + O2, and the OH emission intensity is proportional to O3 concentration. Below is a plot of average nightly O and O3 concentration profiles acquired near the SDSS telescope. The data has been binned into 2 hour intervals, with the solid line representing local midnight. The dotted lines represent the time bins before local midnight, and the dash-dotted lines represent the bins after local midnight. SABER showed a significant enhancement to the O and O3 concentrations on the bottom side of the OH emission layer. 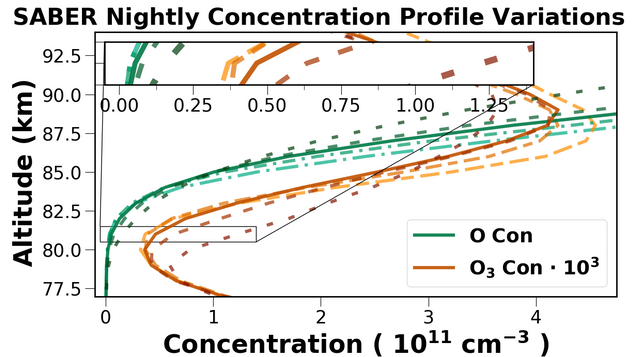
The O3 enhancement on the bottom side of the OH emission layer effectively increases the layer width, and since ground based instrument measure a column of emission this effectively increases the observed intensity. After local midnight the emission intensity increases at the altitude of peak emission.

The plots below show the average nightly variations in temperature, O and O3 concentrations, and OH 2.0 micron and OH 1.6 micron VER.

For more detailed information about OH emission, and the temporal variations in intensity see my manuscript at this link https://doi.org/10.1088/1538-3873/aae972.