Sky Subtraction
Ground based spectra not only sample the astronomical target, but also atmospheric absorption and emission. In the visible the Earth’s atmosphere primarily emits, and the night sky spectrum can be seen on the webpage here http://sites.bu.edu/murdock-hart/airglow/. The raw spectrum below contains contributions from an astronomical science target, and atmospheric airglow emission.

The brightest OH lines can be several orders of magnitude brighter than the astronomical target. The spectrum below has separated the astronomical target, a quasar in this case, and the atmospheric airglow. Notice the intensity difference between the bright OH lines and the quasar.

The removal of the bright sky spectrum from a faint astronomical spectrum proves to be problematic. The Sloan Digital Sky Survey (SDSS) places fibers on blank patches of sky, termed sky fibers, to sample the atmospheric emission present during a science exposure. These sky fibers are placed across the field of view, and a sky estimate at the location of a science fiber is created by interpolating the sky fibers across the field of view in essence creating a sky surface as a function of wavelength. The spectrum below exhibits residual features at the locations of the brightest emission lines.

These residual features are primarily a consequence of small shifts in the wavelength solutions between spectra due to differences in pixel sampling across the detector. When the subtraction component of a bright line is slightly shifted in wavelength the wings of the line leave large plus minus residuals, and cause an under subtraction at the center of the line.
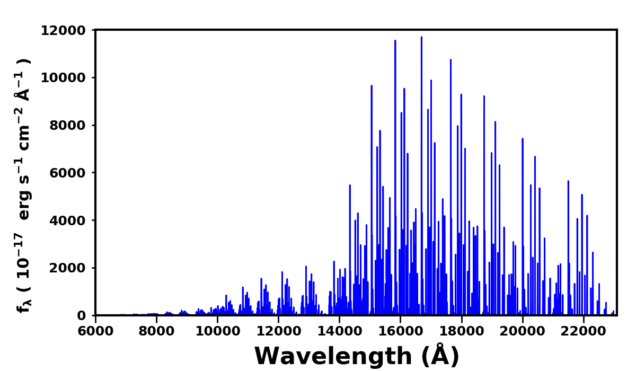
The sky subtraction problem only becomes more difficult in the near infrared. The OH spectrum above is similarly scaled to the other OH spectra on this page.