Sensitivity
Sensitivity
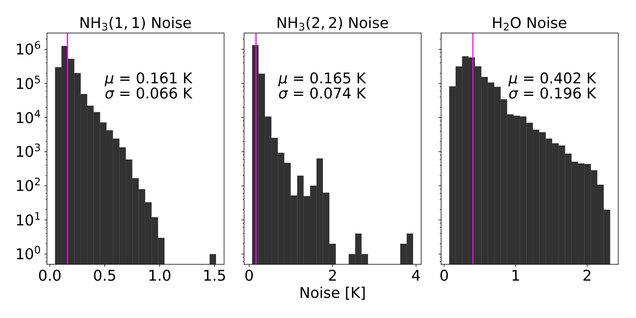
Due to the impressive capabilities of the GBT instrumentation, RAMPS data have relatively good sensitivity. Shown below are histograms of the root-mean-square (rms) noise for each NH3(1,1), NH3(2,2), and H2O spectrum in the pilot survey. The mean (µ) and standard deviation (σ) of each noise distribution is given, with the mean also indicated by a magenta line. The rms for the NH3 data (~0.16 K for 0.2 km/s channel width) is much lower than that of the H2O data (~0.4 K for 0.14 km/s channel width) because we observe NH3 with all seven receivers and H2O with only one. Although the noise distributions show evidence of spectra with large rms values, these generally occur at the edges of maps or in spectra with significant residual baselines and neither of these populations constitute a large portion of the dataset.
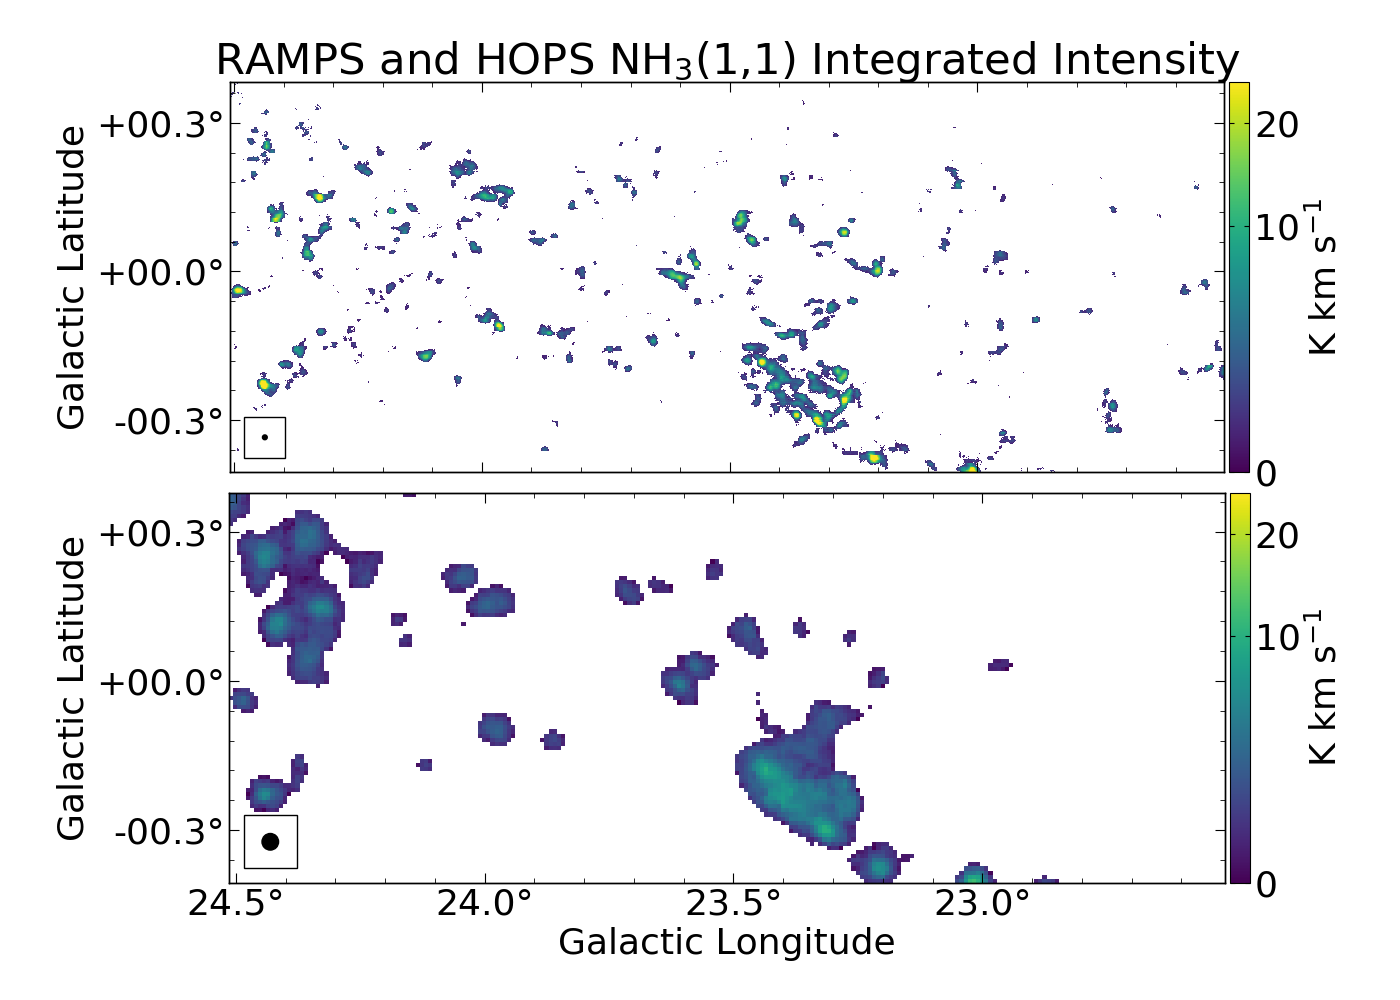
HOPS, a previous large NH3 survey, observed 100 square degrees of the Galactic plane and catalogued hundreds of molecular clumps. Below we show a comparison between RAMPS and HOPS NH3(1,1) integrated intensity maps of the same field. The beam size of the surveys are shown in the lower left of each map. Because the GBT dish is approximately five times larger than that of Mopra, the GBT beam size is smaller by the same factor. This gives RAMPS superior angular resolution, while both surveys have similar noise distributions for the NH3 data. Good sensitivity and angular resolution allows us to resolve many of the molecular clumps observed by HOPS, while also detecting fainter clumps that were beam diluted in the HOPS data. Hence, even though we will survey a much smaller area than HOPS, we still expect to detect a statistically significant sample of molecular clumps.
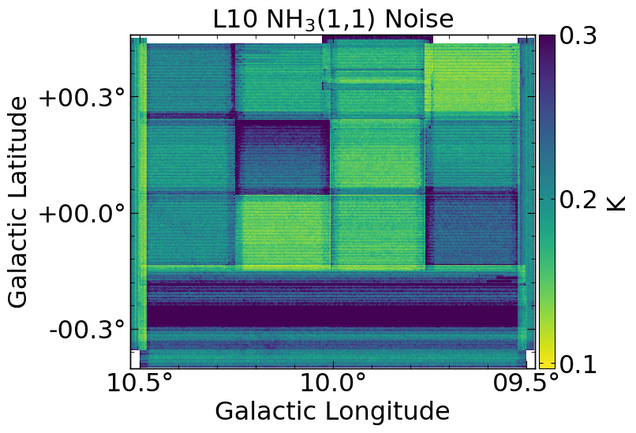
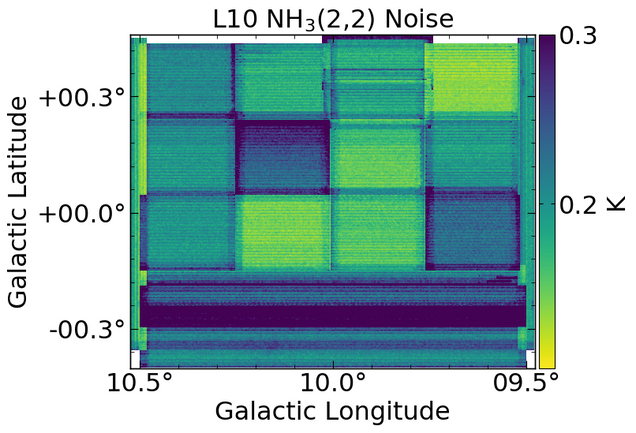
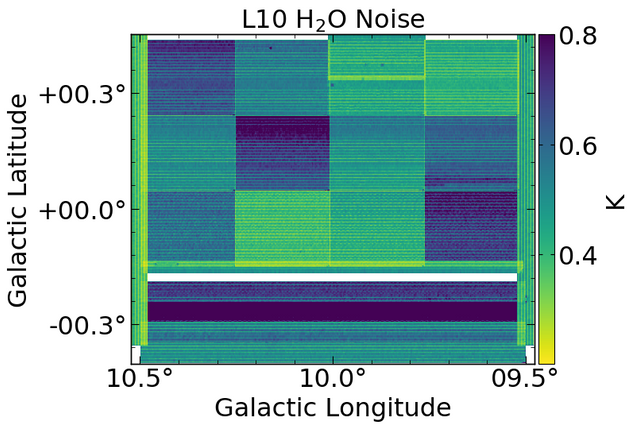
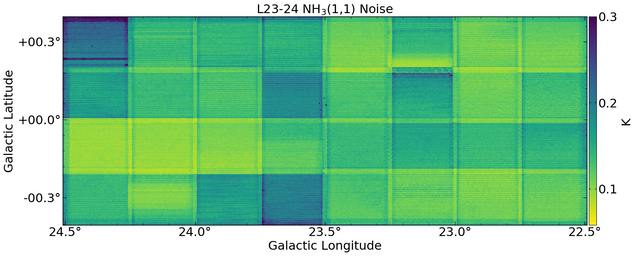
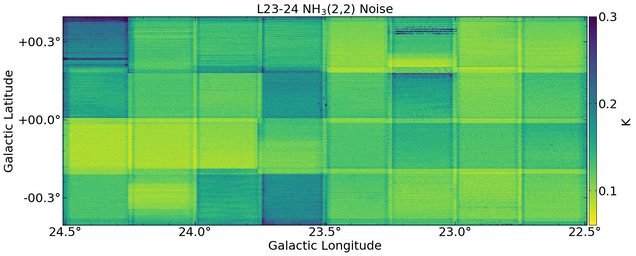
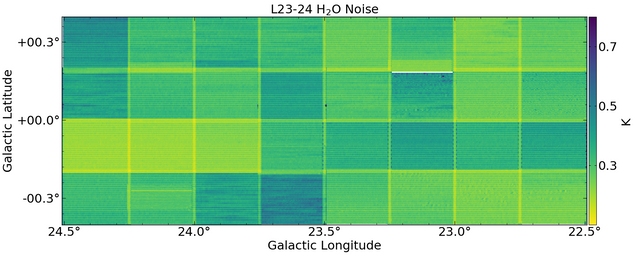
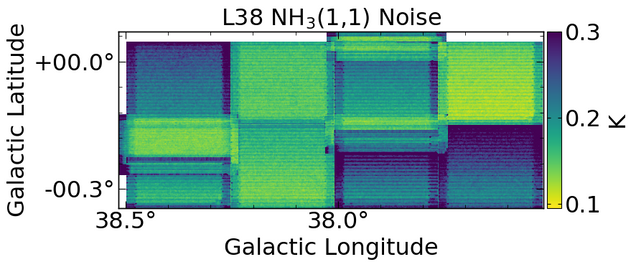
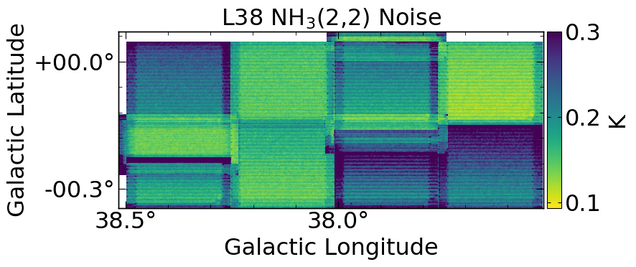
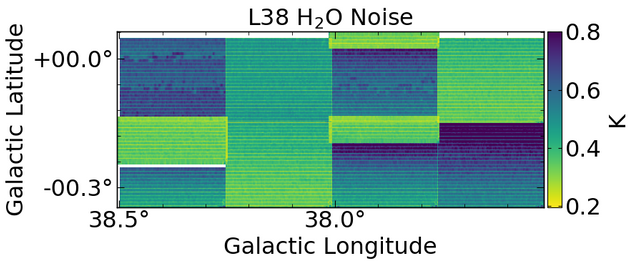
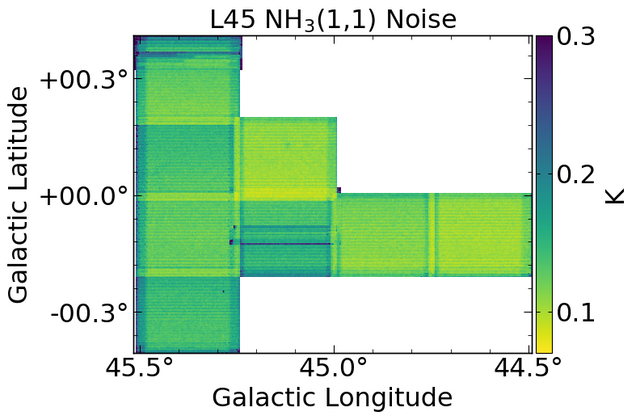
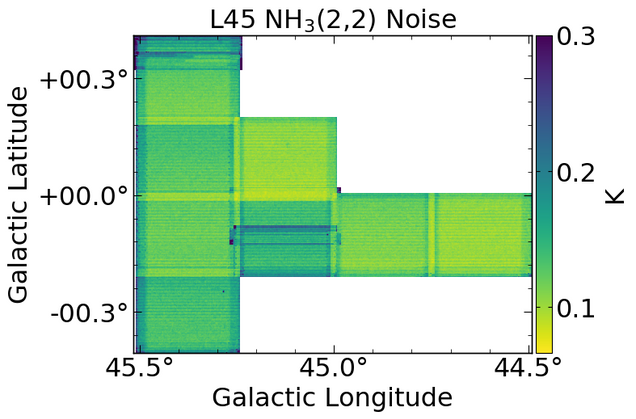
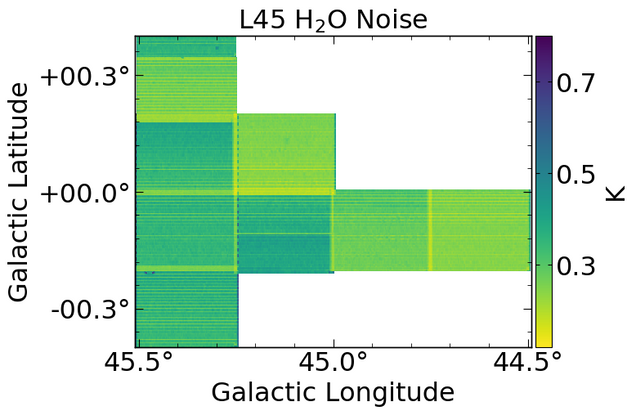
Below we show the NH3(1,1), NH3(2,2), and H2O noise maps for the pilot survey. Because we observed adjacent tiles in different weather conditions and at different elevations, there are sometimes discontinuities in the data quality across a 1˚ field. Fortunately, the majority of clumps are small enough to be contained within a single tile. There are also variations in the noise within tiles due to changing weather conditions, combining partial observations of a single tile, and to our scanning strategy, which produces small noise jumps in the Galactic latitude direction. Thus, analysis of this dataset should take into account the uneven noise characteristics.
