Data
It’s been said that IT folks working in education are closest to current technology trends, and that student use of technology can be an indication of where our industry is going. Do they prefer Mac or PC? Are they carrying one device or seven? Are there any new “must-have applications? What do students find to be their biggest challenges when working with technology? Do we, in fact, have our very own IT crystal ball at Boston University?
We personally do find that the data we’ve gathered does provide some insight as to where the IT industry is going. As the project progresses, we’ll continue to expand these data pages and share with you the trends that we have noticed. However, don’t take our word for it; please explore the information on the pages here and judge for yourself.
We hope you find this data as interesting as we do!
![]()
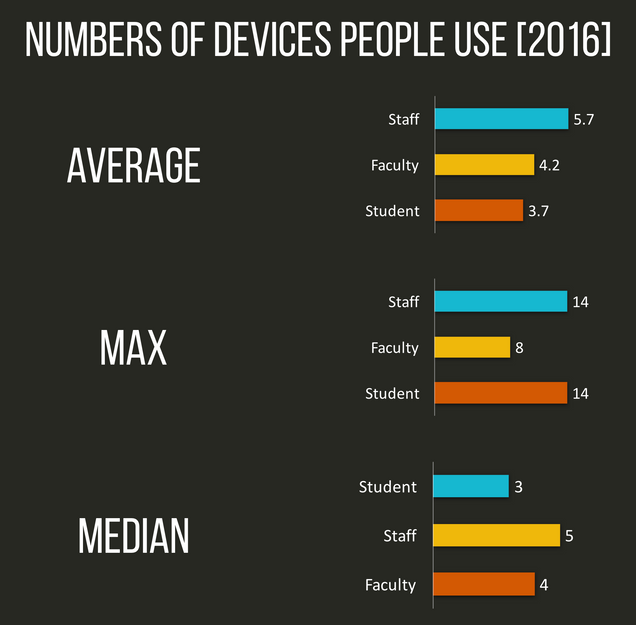
This chart shows the typical number of technical gadgets survey respondents use regularly in 2016. We’d been hearing for years that “computers are going away” and soon “there would be one device to rule them all.” However, our observation has been that people are accumulating devices, not phasing them out… and our data supports this observation.
We suspect that staff and faculty edge out students for average and median number of devices because of budget. Often, BU schools and departments provide faculty and staff with BU-owned devices, supplementing the gadgets they already own.