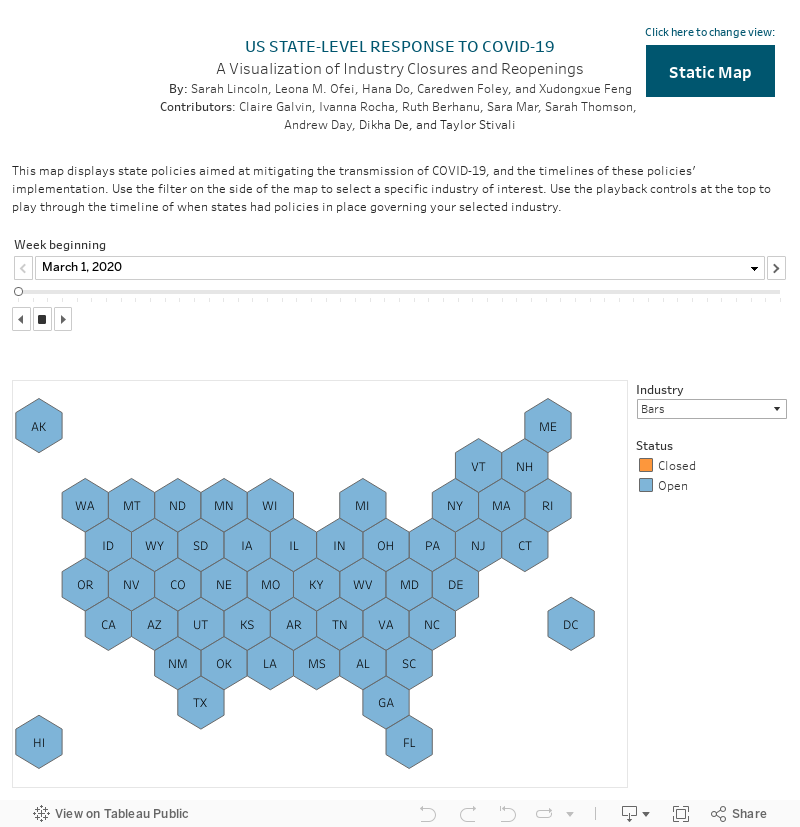
Using publicly available data sources, the team constructed an interactive dashboard of state-level policies in the United States enacted over the course of the COVID-19 pandemic. Viewers can interact with an animated map comparing active and inactive state-level policies across time. More specifically, the tool includes details and dates of specific state-level policies such as mask mandates as well as openings\/closings of specific industries including: restaurants, bars, places of worship, movie theaters, gyms, non-essential retail, and personal care facilities. The platform also includes the option to view details of all policies at once for each state via the static map feature.<\/p>\n
The dashboard was created using data from Dr. Julia Raifman’s (BUSPH) policy database<\/a> as well as other publicly available data sources. The dashboard will be updated regularly to reflect changes in state policy related to industry restrictions. The team welcomes feedback via email (epicovidcorps@bu.edu).<\/p>\n <\/p>\n\n
Visualization<\/h4>\n