US State-level Response to COVID-19
A Visualization of Industry Closures and Reopenings
Sarah Lincoln, Leona M. Ofei, Hana Do, Caredwen Foley; Mentor: Dr. Ellie Murray
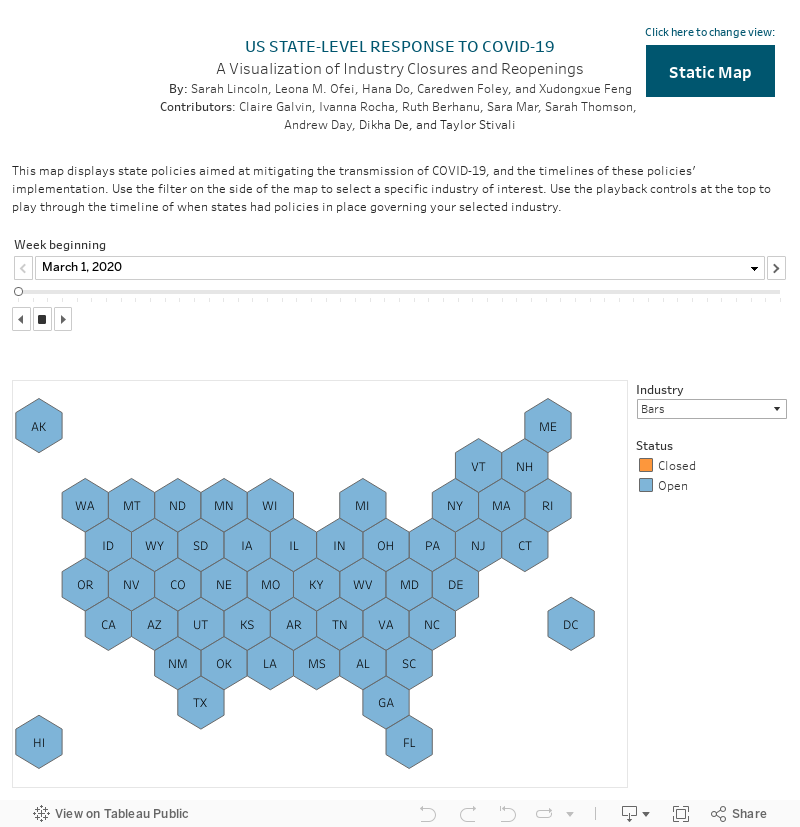
Using publicly available data sources, the team constructed an interactive dashboard of state-level policies in the United States enacted over the course of the COVID-19 pandemic. Viewers can interact with an animated map comparing active and inactive state-level policies across time. More specifically, the tool includes details and dates of specific state-level policies such as mask mandates as well as openings/closings of specific industries including: restaurants, bars, places of worship, movie theaters, gyms, non-essential retail, and personal care facilities. The platform also includes the option to view details of all policies at once for each state via the static map feature.
The dashboard was created using data from Dr. Julia Raifman’s (BUSPH) policy database as well as other publicly available data sources. The dashboard will be updated regularly to reflect changes in state policy related to industry restrictions. The team welcomes feedback via email (epicovidcorps@bu.edu).
- Read more about the methods (PDF)
Visualization