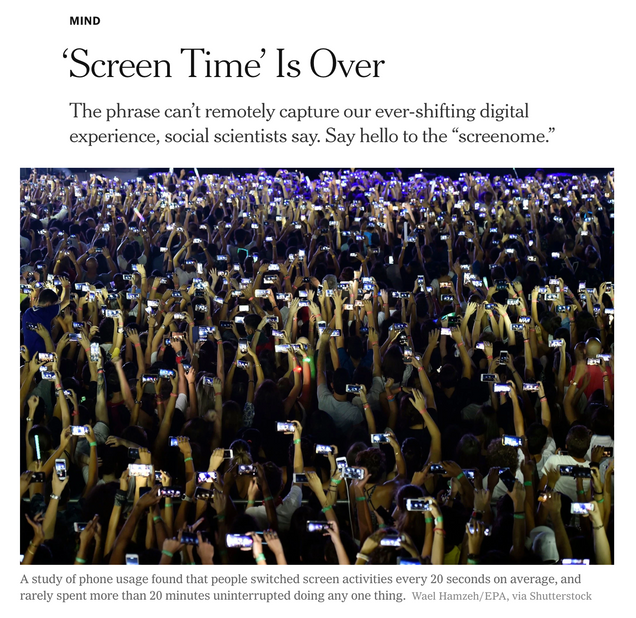
A New York Times article about the changing nature of our digital experiences cites a recently-published paper in Human-Computer Interaction co-authored by the CRC’s Jim Cummings.
The concept of “screen time” has been long used to understand how—and for how long—individuals interact with their devices. But as more applications have become available to internet users, understanding people’s digital experiences and how often they switch between tasks has become more complicated.
“Consider what a person can do in just the time it takes to wait for a bus: text, watch a comedy skit, play a video game, buy concert tickets, take five selfies, each with a different set of cartoon ears,” explains The New York Times’ Benedict Carey.
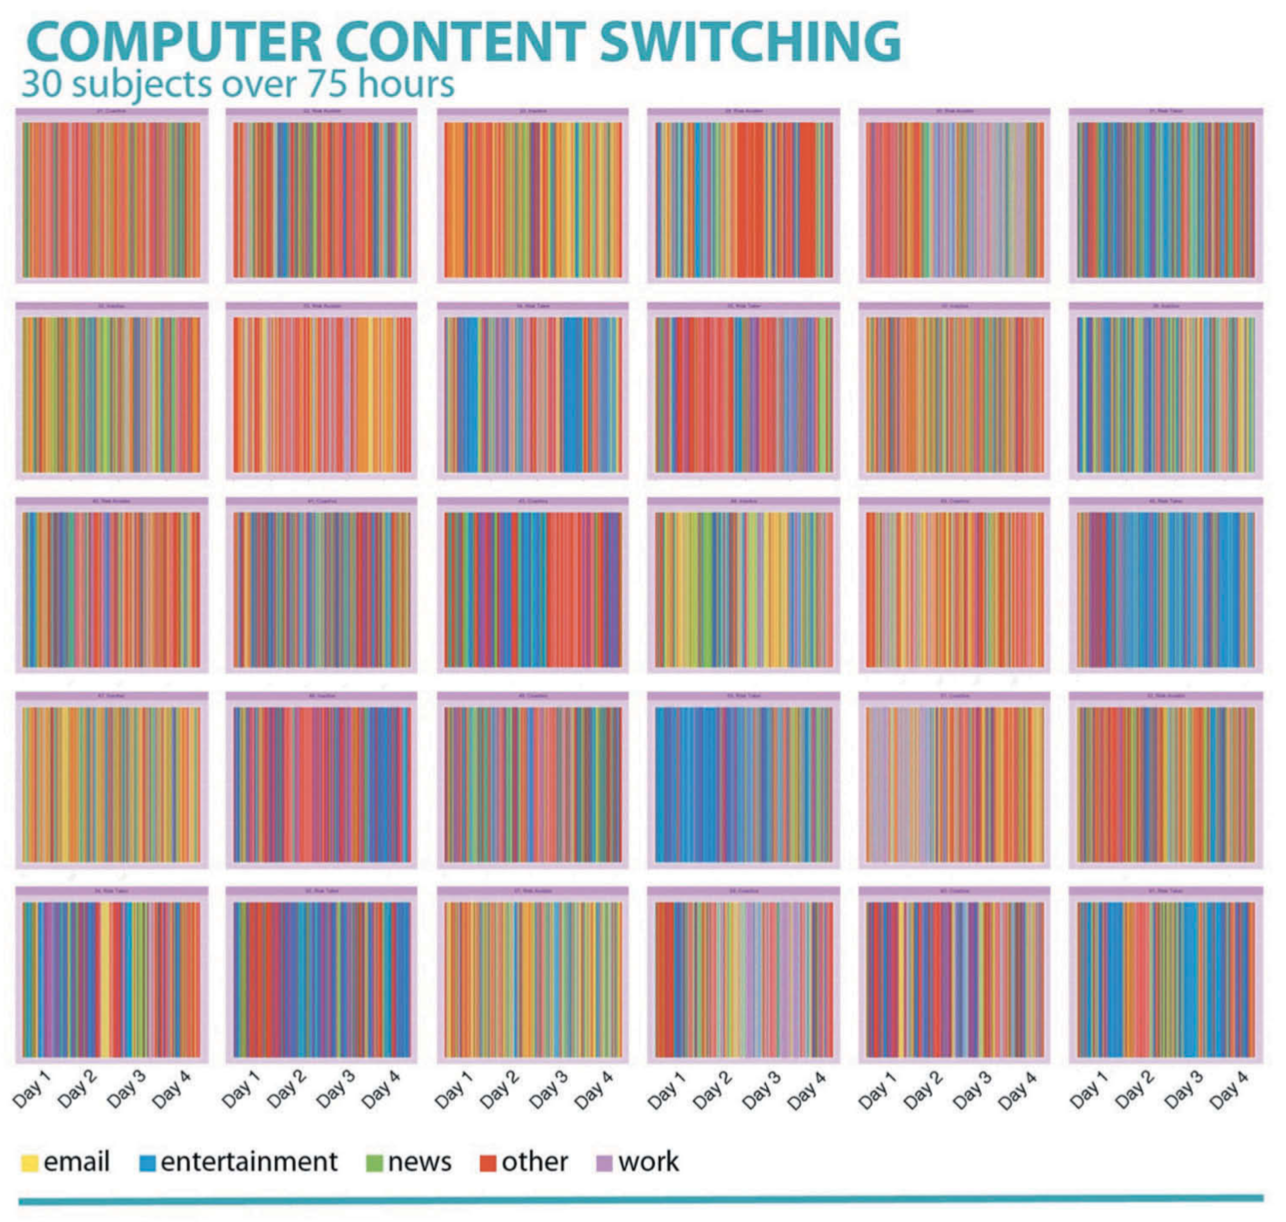
As a response to this newfound complexity and fragmentation of experience, Cummings and his co-researchers documented, via screenshots, the digital activity of 30 participants. The resulting digital records, they write, are best conceived of as “screenomes”—adapted from the word “genome.”

Researchers reported that, on average, participants switched from one screen activity to another every 20 seconds and spent hardly 20 minutes on one continuous activity. Their findings were presented as a stream of color-coded graphs (shown at left) depicting what kind of activities individuals used their screens for—entertainment, news, or work, for instance—and how they switched between these tasks.
Quoted in The New York Times’ piece, co-author Byron Reeves (Professor of Communication at Stanford University) explained the significance of their proposed “screenomic” framework.
“It’s very counterintuitive to say at this stage, but the fact is, no one really knows what the heck people are seeing on their screens. To understand what’s happening, we need to know what exactly that is.”