In the Press
Artificial Intelligence Special Topic at ICCS 2018
The New England Complex Systems Institute has put together a great program for their 9th International Conference on Complex Systems. Eugene Stanley, who I've been collaborating with at BU, is being honored Monday morning with the Herbert A. Simon Award. Mark Kon, who's co-authored papers with me on nonlinear statistical coupling, is hosting a workshop on "Evolution and Lifespan" on Monday afternoon. My own talk "Accuracy and Robustness of Machine Learning Predictions" will be on Wednesday afternoon as part of the sessions on Machine Learning and Artificial Intelligence.
Hope to see you there!!

Estimator using the geometric mean
https://arxiv.org/abs/1804.03989
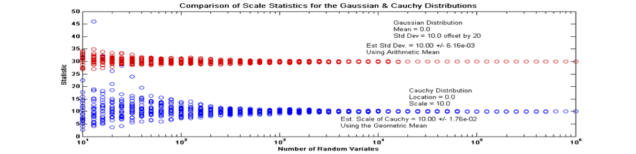
The geometric mean can be used to estimate the scale of a Coupled Gaussian. Shown is comparison of the estimates for the variance of Gaussian distribution and the scale of a Cauchy Distribution. A proof is provided showing the relationship between the geometric mean of the coupled Gaussian distributions and the scale of the distributions. Numerical evidence is provided that for a wide range of tail decay the estimator is unbiased and has diminishing variance as the number of samples increases.
Assessing the accuracy of predictions
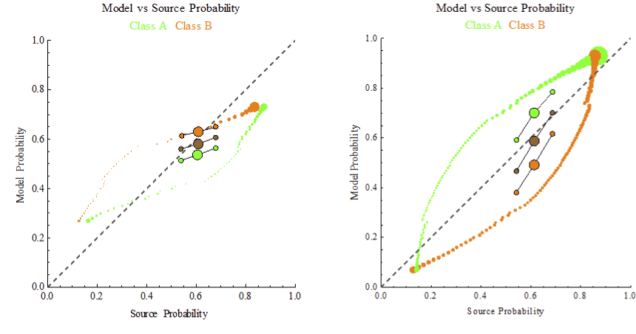
The calibration curve for the accuracy of of probabilistic forecast is aggregated into a metrics of decisiveness, accuracy and robustness. The y-axis is the forecasted probability. The x-axis is a histogram of a source used for testing of the decision algorithm. The green and orange curves represent a histogram of the model-predicted versus source-measured probabilities. The large brown bubble is the average accuracy of the forecast as measured by the geometric mean of the probabilities. The smaller bubble above the accuracy indicates the decisiveness as measured by the arithmetic mean of the probabilities. The bubble below the accuracy indicates the robustness as measured by the -2/3 generalized mean of the probabilities. On the left is an algorithm which is under-confident, i.e. its forecasted probabilities are closer to 0.5 than actually occurs in the test sample. The right graph is of an over-confident algorithm in which the forecasted probabilities are closer to 0 and 1 than the test sample distribution.
Entropy 2017, 19(6), 286; doi:10.3390/e19060286